Parent info
Parts you need
Affiliate links — we may earn a small commission
Try this circuit in your browser!
Run the code, press the buttons and watch what happens — before you buy any parts. No account needed.
Open in Simulator →Your classmates guessed. You measured.
Imagine this: your Earth Science class is studying soil erosion. Everyone else pours water on three cups of dirt, watches it drain, and writes down “clay held the most water” — based on vibes.
You set up three capacitive moisture sensors, each in a different soil type. Every 10 seconds, your ESP32 reads all three, logs the data, and posts a live graph to a webpage you can pull up on any phone in the room.
“Loam retained 34% more moisture than sand after 5 minutes.” That’s not a guess. That’s a measurement.
That’s what we’re building. For about $25.
What you’ll need
| Part | What it does | Price |
|---|---|---|
| ESP32-S3-DevKitC-1 | Brain — reads sensors, serves web dashboard | ~$12 |
| Capacitive soil moisture sensors ×3 | One per soil type — no corrosion, accurate readings | ~$9 |
| Breadboard + jumper wires | Connects everything | ~$5 |
| USB-C data cable | Power + code upload | ~$5 |
You also need: 3 identical containers, 3 soil types (sand, loam/garden soil, clay), water, ruler.
Total: ~$25 | Time: ~2–3 hours | Difficulty: ●●○○○
How it works (60 seconds)
A capacitive moisture sensor is basically two metal plates separated by the soil. Wet soil conducts electricity better than dry soil, which changes the capacitance between the plates. The sensor converts that into a voltage (0–3.3V), and the ESP32 reads it on an analog pin (ADC).
Think of it like squeezing a sponge — the wetter it is, the more electricity can flow through it.
The ESP32 reads all three sensors every 10 seconds, calculates moisture percentage, and serves a tiny webpage you can view on any phone connected to the same WiFi network.
Step 0: Set up your soil experiment
Time: ~30 minutes
This is the Earth Science part — the sensors just make it measurable.
Three soil types (label your containers A, B, C):
- Container A: Sand (coarse, no organic material)
- Container B: Garden loam (balanced mix)
- Container C: Clay (fine particles, dense)
Prep each container:
- Fill each container with 300g of dry soil (weigh it for consistency)
- Make a hole in the center with a pencil
- Push one moisture sensor 2 inches deep — vertical
- Let soil settle around the sensor
The experiment: Add exactly 100ml of water to each container at the same time. Record moisture every 10 seconds for 10 minutes. Compare how quickly each soil absorbs then loses moisture.
Check: Before adding water, all three sensors should read roughly the same (dry soil). If one reads very differently, it may not be inserted fully — push it deeper.
Step 1: Wire it up
Time: ~15 minutes
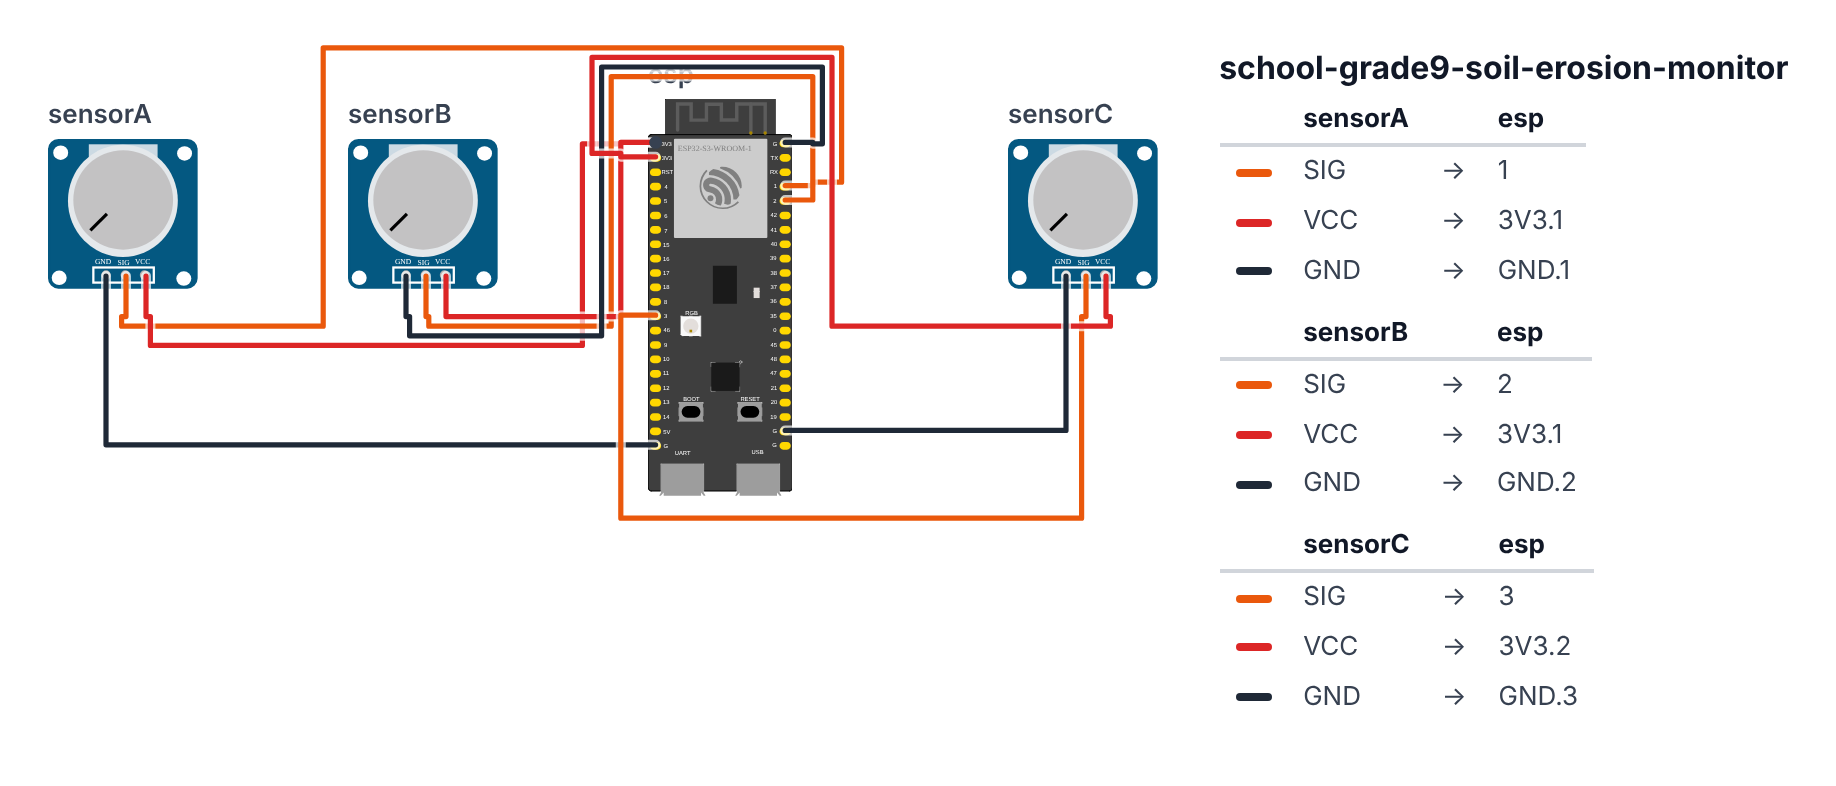
Each sensor has 3 wires: VCC (red), GND (black), AOUT (signal).
Sensor A (Sand):
- AOUT → GPIO 1 (C6: GPIO 0) (ADC1_CH0)
- VCC → 3.3V
- GND → GND
Sensor B (Loam): 4. AOUT → GPIO 2 (C6: GPIO 1) (ADC1_CH1) 5. VCC → 3.3V 6. GND → GND
Sensor C (Clay): 7. AOUT → GPIO 3 (C6: GPIO 2) (ADC-capable) 8. VCC → 3.3V 9. GND → GND
Check: Nine wires total — 3 sensors × 3 wires. All VCC go to 3.3V (NOT 5V — these sensors are 3.3V logic). All GND share the same GND rail.
Step 2: Flash the code
Time: ~15 minutes
The big picture first. This program is a three-sensor soil laboratory:
- Three capacitive soil sensors each report a voltage. Wetter soil = lower voltage. The ESP32 reads all three.
- The
readMoisturePct()function converts each raw voltage to a 0–100% moisture percentage. - The ESP32 runs a web server: any phone on your WiFi can open a webpage and see live colored bar charts for all three soil types.
A program is like a recipe. The computer reads it top to bottom and does exactly what is written, nothing more. Copy this entire recipe into Arduino IDE and upload it:
// ========== CHOOSE YOUR BOARD ==========
// Uncomment the line for YOUR board:
#define BOARD_S3    // ESP32-S3-DevKitC-1
//#define BOARD_C6  // ESP32-C6-DevKitC-1
// ========================================

#ifdef BOARD_S3
  #define PIN_SENSOR_A  1
  #define PIN_SENSOR_B  2
  #define PIN_SENSOR_C  3
#endif
#ifdef BOARD_C6
  #define PIN_SENSOR_A  0
  #define PIN_SENSOR_B  1
  #define PIN_SENSOR_C  2
#endif

#include <WiFi.h>
#include <WebServer.h>

const char* ssid = "YOUR_WIFI_NAME";
const char* password = "YOUR_WIFI_PASSWORD";

WebServer server(80);

const int DRY_VAL = 3300;
const int WET_VAL = 1200;

int readMoisturePct(int pin) {
  int raw = analogRead(pin);
  int pct = map(raw, DRY_VAL, WET_VAL, 0, 100);
  return constrain(pct, 0, 100);
}

int historyA[60], historyB[60], historyC[60];
int readingCount = 0;
unsigned long lastRead = 0;

void handleRoot() {
  int a = readMoisturePct(PIN_SENSOR_A);
  int b = readMoisturePct(PIN_SENSOR_B);
  int c = readMoisturePct(PIN_SENSOR_C);

  String html = "<!DOCTYPE html><html><head><meta charset='utf-8'>";
  html += "<meta name='viewport' content='width=device-width,initial-scale=1'>";
  html += "<title>Soil Erosion Monitor</title>";
  html += "<style>body{font-family:sans-serif;padding:20px;background:#f5f5f5}";
  html += ".card{background:white;border-radius:8px;padding:16px;margin:10px 0;box-shadow:0 2px 4px rgba(0,0,0,.1)}";
  html += ".bar{height:24px;background:#4CAF50;border-radius:4px;transition:width 0.5s}";
  html += ".label{font-size:14px;color:#666;margin-bottom:4px}</style>";
  html += "<meta http-equiv='refresh' content='10'></head><body>";
  html += "<h2>Soil Erosion Monitor</h2>";

  html += "<div class='card'><div class='label'>Sand (A): " + String(a) + "% moisture</div>";
  html += "<div style='background:#eee;border-radius:4px'><div class='bar' style='width:" + String(a) + "%;background:#f4a460'></div></div></div>";

  html += "<div class='card'><div class='label'>Loam (B): " + String(b) + "% moisture</div>";
  html += "<div style='background:#eee;border-radius:4px'><div class='bar' style='width:" + String(b) + "%;background:#4CAF50'></div></div></div>";

  html += "<div class='card'><div class='label'>Clay (C): " + String(c) + "% moisture</div>";
  html += "<div style='background:#eee;border-radius:4px'><div class='bar' style='width:" + String(c) + "%;background:#8B4513'></div></div></div>";

  html += "<p style='color:#999;font-size:12px'>Auto-refresh every 10s. Readings: " + String(readingCount) + "</p>";
  html += "<p><a href='/data'>Download CSV data</a></p>";
  html += "</body></html>";

  server.send(200, "text/html", html);
}

void handleData() {
  String csv = "Reading,Sand(%),Loam(%),Clay(%)\n";
  for (int i = 0; i < min(readingCount, 60); i++) {
    csv += String(i) + "," + String(historyA[i]) + "," + String(historyB[i]) + "," + String(historyC[i]) + "\n";
  }
  server.send(200, "text/csv", csv);
}

void setup() {
  Serial.begin(115200);
  WiFi.begin(ssid, password);
  while (WiFi.status() != WL_CONNECTED) {
    delay(500);
    Serial.print(".");
  }
  Serial.println("\nConnected! IP: " + WiFi.localIP().toString());

  server.on("/", handleRoot);
  server.on("/data", handleData);
  server.begin();
}

void loop() {
  server.handleClient();

  if (millis() - lastRead > 10000) {
    lastRead = millis();
    int idx = readingCount % 60;
    historyA[idx] = readMoisturePct(PIN_SENSOR_A);
    historyB[idx] = readMoisturePct(PIN_SENSOR_B);
    historyC[idx] = readMoisturePct(PIN_SENSOR_C);
    readingCount++;
    Serial.printf("Sand:%d%% Loam:%d%% Clay:%d%%\n", historyA[idx], historyB[idx], historyC[idx]);
  }
}
Line-by-line: what every line does and why
Lines 1–2: Borrowing ready-made instruction books
#include <WiFi.h>
#include <WebServer.h>
#include means “grab this instruction book.” WiFi handles connecting the ESP32 to your home network. WebServer lets the ESP32 act as a tiny website — your phone can open a page on it just like visiting any website.
Lines 4–5: Your WiFi login
const char* ssid = "YOUR_WIFI_NAME";
const char* password = "YOUR_WIFI_PASSWORD";
const char* is a text box that never changes. Replace these two values with your actual WiFi name and password. The ESP32 needs this to join your network so your phone can connect.
Lines 7–13: Sensor pin names and calibration
#define PIN_SENSOR_A  1
#define PIN_SENSOR_B  2
#define PIN_SENSOR_C  3

const int DRY_VAL = 3300;
const int WET_VAL = 1200;
The three sensor pins are the ESP32 legs where the signal wires connect: legs 1, 2 and 3 (C6: legs 0, 1 and 2). const int is a number that never changes — like a constant in math class. DRY_VAL = 3300 is the raw number the sensor gives when the soil is completely dry. WET_VAL = 1200 is what it gives when the soil is soaked. These are your calibration endpoints — the full scale of your ruler.
Lines 15–19: readMoisturePct() — the conversion function
int readMoisturePct(int pin) {
  int raw = analogRead(pin);
  int pct = map(raw, DRY_VAL, WET_VAL, 0, 100);
  return constrain(pct, 0, 100);
}
This mini recipe takes a pin number and gives back a moisture percentage. analogRead(pin) reads the voltage on that leg and converts it to a number from 0 to 4095 — that is the raw ADC reading. map() is a ruler converter: it takes the raw number (which lives between DRY_VAL and WET_VAL) and stretches it to fit the range 0–100. Dry soil maps to 0%, soaking wet maps to 100%. constrain(pct, 0, 100) clamps the result — if the sensor gives a strange reading outside the calibration range, it is forced to stay between 0 and 100.
Lines 21–23: Memory boxes
int historyA[60], historyB[60], historyC[60];
int readingCount = 0;
unsigned long lastRead = 0;
Three shelves, each with 60 compartments — one per reading over 10 minutes. readingCount is a tally of how many readings have been taken. unsigned long is a very large whole number, needed because millis() (the stopwatch) can count to over 4 billion milliseconds.
Lines 25–54: handleRoot() — builds the webpage
void handleRoot() {
  int a = readMoisturePct(PIN_SENSOR_A);
  int b = readMoisturePct(PIN_SENSOR_B);
  int c = readMoisturePct(PIN_SENSOR_C);
Every time a phone opens the main page, this function runs. It immediately reads all three sensors to get fresh numbers.
  String html = "<!DOCTYPE html>...";
  html += "<div class='bar' style='width:" + String(a) + "%'></div>";
String html is a big text box being assembled piece by piece. += means “add this to the end.” The bar chart works by setting the CSS width to the moisture percentage — a 70% wide colored div looks like a bar that is 70% full. The String(a) call converts the number 70 to the text “70” so it can be inserted into the HTML.
  server.send(200, "text/html", html);
}
server.send() delivers the finished HTML page to the phone that asked for it. 200 means “OK, here is your page.” "text/html" tells the browser it is receiving a webpage.
html += "<meta http-equiv='refresh' content='10'>";This one line makes the browser automatically reload the page every 10 seconds — so the bars update without anyone touching their phone.
Lines 56–64: handleData() — CSV download
void handleData() {
  String csv = "Reading,Sand(%),Loam(%),Clay(%)\n";
  for (int i = 0; i < min(readingCount, 60); i++) {
    csv += String(i) + "," + String(historyA[i]) + ... + "\n";
  }
  server.send(200, "text/csv", csv);
}
When a phone visits /data, this sends a CSV file. \n is a newline — it ends each row. min(readingCount, 60) picks the smaller of the two numbers — so if only 20 readings have been taken, the loop runs 20 times, not 60.
Lines 66–80: setup() — morning routine
WiFi.begin(ssid, password);
while (WiFi.status() != WL_CONNECTED) {
  delay(500);
  Serial.print(".");
}
Serial.println("\nConnected! IP: " + WiFi.localIP().toString());
Connect to WiFi. while keeps looping as long as the connection is not ready — printing a dot every 0.5 seconds while waiting. Once connected, print the IP address. You need to type this IP into your phone’s browser.
server.on("/", handleRoot);
server.on("/data", handleData);
server.begin();
server.on() registers which function runs for which web address. Think of it like posting a sign: “If someone knocks on the / door, send them to handleRoot.” server.begin() opens the doors.
Lines 82–92: loop() — runs forever
server.handleClient();This one line checks if any phone has sent a web request and answers it. Without this in loop(), the web server would never respond.
if (millis() - lastRead > 10000) {
  lastRead = millis();
  int idx = readingCount % 60;
  historyA[idx] = readMoisturePct(PIN_SENSOR_A);
  historyB[idx] = readMoisturePct(PIN_SENSOR_B);
  historyC[idx] = readMoisturePct(PIN_SENSOR_C);
  readingCount++;
  Serial.printf("Sand:%d%% Loam:%d%% Clay:%d%%\n", ...);
}
Every 10,000 milliseconds (10 seconds), take a reading from all three sensors. readingCount % 60 is the remainder trick — after slot 59 it wraps back to 0, so the 60-compartment shelf never overflows. Serial.printf is like Serial.println but with %d as a placeholder for a number — cleaner formatting for CSV-style output.
The whole thing in one sentence
On power-on, connect to WiFi and start the web server (setup). Then forever, answer web page requests from phones AND take a 3-sensor reading every 10 seconds, storing results for download (loop).
First thing to try: After uploading, find the IP address in Serial Monitor. Open it in your phone’s browser. All three bars should show near 0%. Then pour 50ml of water into one container and watch that bar climb on the next page refresh (10 seconds).
Upload. Open Serial Monitor. Note the IP address printed. Type it into any browser on the same WiFi.
Check: The webpage should show three colored bars with percentage values. They should all show near 0% before you add water.
Step 3: Calibrate your sensors
Time: ~10 minutes
The default DRY_VAL = 3300 and WET_VAL = 1200 are estimates. For accurate results, calibrate:
- Put each sensor in completely dry soil. Note the raw ADC value from Serial Monitor.
- Submerge each sensor in water. Note the raw ADC value.
- Update
DRY_VALandWET_VALin the code and re-upload.
Pro tip: All three sensors should read nearly the same raw value in identical conditions. If one is very different (>200 off), it may be defective — try it in a different analog pin.
Step 4: Run the experiment!
Time: 10–15 minutes of data collection
- Make sure all three containers have dry soil, sensors inserted
- Open the web dashboard on your phone
- Add exactly 100ml of water to each container simultaneously
- Watch the moisture percentages climb in real time
- Record every 60 seconds for 10 minutes
- Download the CSV at
/datafor your lab report
What to look for:
- Sand absorbs fast but drains fast (quick rise, quick fall)
- Clay absorbs slowly but retains long (slow rise, stays high)
- Loam is in between (good for farming)
Presentation tip: During your presentation, run the live experiment. Add water while classmates watch the bars climb in real time on the projected dashboard. Then say: “Based on 10 minutes of data, clay retained moisture 2.4× longer than sand. That’s why clay soils erode less but flood more.”
What just happened
You used ADC (Analog-to-Digital Conversion) — the ESP32’s ability to read a voltage and convert it to a number. The moisture sensor outputs 0–3.3V; the ESP32 reads that as 0–4095 (12-bit resolution). You then mapped that to a 0–100% scale.
You also built a web server on a $12 chip — the ESP32 runs a full HTTP server, serving HTML pages to any browser on your WiFi. This is exactly how your home router serves its settings page.
Curriculum connections:
- NGSS ESS2-2: Analyze and interpret data on the distribution of fossils and rocks, continental shapes, and seafloor structures to provide evidence of the past plate motions
- NGSS ESS3-3: Apply scientific principles to design a method for monitoring and minimizing a human impact on the environment
- Common Core Math: Represent and interpret data, understand ratio and proportion
The soil moisture readings are quantitative data. Your bar chart is a data visualization. Your CSV is a dataset. This is how environmental scientists actually monitor soil — with exactly these sensors, just more of them.
Level Up
Add rainfall simulation: Use a small water pump (submersible, $3) on GPIO 16 (C6: GPIO 10) to simulate controlled rainfall amounts. “2ml burst” vs “20ml flood.”
Outdoor deployment: Power with a USB battery bank, waterproof the electronics in a ziplock bag. Leave it outside for a week. Correlate moisture readings with actual weather data.
Three slopes: Repeat the experiment with soil containers tilted at 0°, 15°, and 30°. Measure how slope angle affects erosion/retention.
Troubleshooting
| Problem | Fix |
|---|---|
| All sensors read 0% or 100% | Calibrate DRY_VAL and WET_VAL for your specific sensors — see Step 3. |
| Webpage doesn’t load | Check Serial Monitor for the IP address. Make sure phone is on same WiFi. Try http:// not https://. |
| One sensor reads differently | Try swapping to a different analog pin. On ESP32-S3, use ADC1 pins (GPIO 1–10; C6: GPIO 0–6) — ADC2 can conflict with WiFi. |
| Readings jump around | Add delay(10) after each analogRead(). Average 3 readings: (analogRead(pin) + analogRead(pin) + analogRead(pin)) / 3 |
| Upload fails | Hold BOOT button while clicking Upload. |