Parent info
Parts you need
Affiliate links — we may earn a small commission
Try this circuit in your browser!
Run the code, press the buttons and watch what happens — before you buy any parts. No account needed.
Open in Simulator →Your classmates measured plants with a ruler. You built a plant data logger.
Imagine this: your class is growing bean plants for a life science experiment. Everyone else checks their plant once a week, writes down “2 inches,” and calls it done. You walk in with a chart showing exactly how much light your plant received each hour for the past week, and exactly how wet the soil was — and you can prove which conditions made it grow faster.
That’s the difference between a class assignment and a real science experiment. Let’s build the real thing.
What you’ll need
| Part | What it does | Price |
|---|---|---|
| ESP32-S3-DevKitC-1 | The brain — runs all the logging code | ~$12 |
| Capacitive soil moisture sensor | Measures how wet the soil is (0–100%). Capacitive = no metal corrosion, lasts longer than cheap resistive sensors. | ~$5 |
| BH1750 light intensity sensor | Measures light in lux — the same unit used in professional grow lights | ~$4 |
| 0.96” OLED display | Shows current readings so you can check at a glance | ~$5 |
| Breadboard + jumper wires | Connects everything. No soldering. | ~$5 |
Total: ~$31 | Time: ~90 minutes | Difficulty: ●●○○○
Capacitive vs. resistive soil sensors: Cheap sensors (usually $1–2) use two metal prongs that corrode in wet soil within a few weeks. The capacitive sensor we’re using measures water content electrically without metal touching the soil. It lasts for months and is far more accurate. Always look for “capacitive” on the label.
How it works (60 seconds)
The soil moisture sensor sends a tiny electrical signal through the soil. Wet soil conducts electricity differently than dry soil — the sensor measures that difference. The light sensor (BH1750) counts photons of light and converts them to lux numbers. The ESP32 reads both sensors every hour, stores the readings, and shows them on the tiny screen. The clever part: you can run two plants side by side and compare their conditions — one near a window, one in a dark corner — and the data shows exactly why one grew faster.
Step 0: Set up your plant experiment
Time: ~10 minutes
Before electronics, set up your science experiment properly. A good experiment needs:
A hypothesis: For example — “Plants grown in higher light intensity (more lux) will grow taller faster than plants in low light.”
A control and a variable:
- Control: One plant in consistent light (e.g., near a south-facing window)
- Variable: One plant in a different condition (darker corner, or under an artificial light)
What you’ll measure with sensors: Light in lux (every hour) + soil moisture percentage (every hour). These are your independent variables. Plant height (measured by ruler weekly) is your dependent variable.
Pro tip: Use the same type of pot, same soil, same amount of water for both plants. Only the light should differ. That way you know light is causing the difference — not something else.
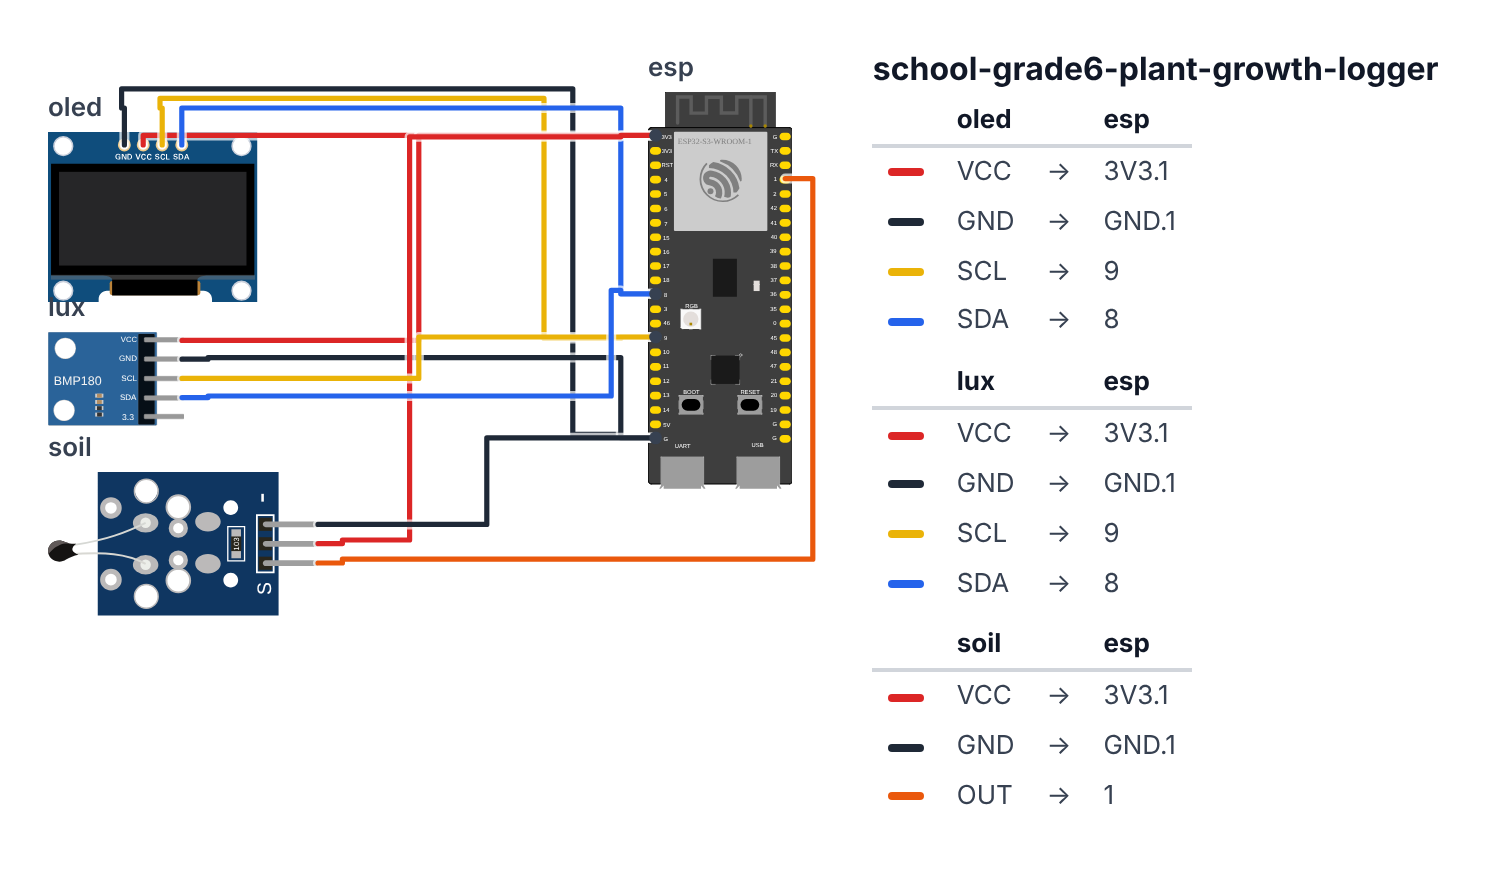
Step 1: Wire it up
Time: ~15 minutes
OLED Display + BH1750 (share I2C bus — 4 wires):
- OLED VCC → board 3.3V — red wire
- OLED GND → board GND — black wire
- OLED SCL → board GPIO 9 (C6: GPIO 7) — yellow wire
- OLED SDA → board GPIO 8 (C6: GPIO 6) — blue wire
- BH1750 VCC → board 3.3V — red wire (same rail)
- BH1750 GND → board GND — black wire (same rail)
- BH1750 SCL → board GPIO 9 (C6: GPIO 7) — yellow wire (same rail)
- BH1750 SDA → board GPIO 8 (C6: GPIO 6) — blue wire (same rail)
Soil Moisture Sensor (3 wires — uses analog input): 9. Sensor VCC → board 3.3V — red wire 10. Sensor GND → board GND — black wire 11. Sensor AOUT (analog out) → board GPIO 1 (C6: GPIO 3) — orange wire
Check: The soil sensor has two outputs — AOUT (analog, gives a number from 0–4095) and DOUT (digital, just gives wet/dry). Use AOUT for actual percentage readings. GPIO 1 (C6: GPIO 3) is an analog-capable pin on the ESP32.
Step 2: Flash the code
Time: ~20 minutes
Install libraries in Arduino IDE (Tools → Manage Libraries):
BH1750by Christopher LawsAdafruit SSD1306by AdafruitAdafruit GFX Libraryby Adafruit
Here is the big picture. This program turns the ESP32 into a plant scientist’s logbook:
- The BH1750 light sensor counts photons and reports them in lux — the unit scientists use for light intensity. A sunny window is ~10,000 lux. A dim room is ~50 lux.
- The soil moisture sensor sends a tiny electrical signal through the soil. Wet soil conducts differently than dry soil. The ESP32 converts that difference into a percentage.
- Every hour, the ESP32 records both readings and sends them to Serial Monitor in CSV format — ready to paste into a spreadsheet.
// ========== CHOOSE YOUR BOARD ==========
// Uncomment the line for YOUR board:
#define BOARD_S3    // ESP32-S3-DevKitC-1
//#define BOARD_C6  // ESP32-C6-DevKitC-1
// ========================================

#ifdef BOARD_S3
  #define PIN_SDA    8
  #define PIN_SCL    9
  #define PIN_SOIL   1
#endif
#ifdef BOARD_C6
  #define PIN_SDA    6
  #define PIN_SCL    7
  #define PIN_SOIL   3
#endif

#include <Wire.h>
#include <BH1750.h>
#include <Adafruit_SSD1306.h>

#define SCREEN_WIDTH 128
#define SCREEN_HEIGHT 64
Adafruit_SSD1306 display(SCREEN_WIDTH, SCREEN_HEIGHT, &Wire, -1);

BH1750 lightMeter;

#define SOIL_PIN PIN_SOIL
#define SOIL_DRY 3200
#define SOIL_WET 1400

#define MAX_READINGS 168
float lightHistory[MAX_READINGS];
int moistureHistory[MAX_READINGS];
int readingIndex = 0;
int totalReadings = 0;

#define LOG_INTERVAL 3600000

unsigned long lastLog = 0;

void setup() {
  Serial.begin(115200);
  Wire.begin(PIN_SDA, PIN_SCL);

  if (!display.begin(SSD1306_SWITCHCAPVCC, 0x3C)) {
    Serial.println("Display not found!");
    while (true);
  }

  if (!lightMeter.begin(BH1750::CONTINUOUS_HIGH_RES_MODE)) {
    display.clearDisplay();
    display.setTextColor(SSD1306_WHITE);
    display.setCursor(0,0);
    display.println("BH1750 not found!");
    display.display();
    while (true);
  }

  display.clearDisplay();
  display.setTextColor(SSD1306_WHITE);
  display.setTextSize(1);
  display.setCursor(0, 0);
  display.println("Plant Logger Ready");
  display.println("Logging every hour");
  display.println("Readings stored: 0");
  display.display();
  delay(2000);

  Serial.println("Plant Growth Logger Started");
  Serial.println("Time(hr),Light(lux),Moisture(%)");
}

int readMoisture() {
  int rawValue = analogRead(SOIL_PIN);

  int moisturePercent = map(rawValue, SOIL_DRY, SOIL_WET, 0, 100);

  moisturePercent = constrain(moisturePercent, 0, 100);

  return moisturePercent;
}

void logReading() {
  float lux = lightMeter.readLightLevel();
  int moisture = readMoisture();

  lightHistory[readingIndex] = lux;
  moistureHistory[readingIndex] = moisture;
  readingIndex = (readingIndex + 1) % MAX_READINGS;
  totalReadings++;

  Serial.print(totalReadings);
  Serial.print(",");
  Serial.print(lux, 1);
  Serial.print(",");
  Serial.println(moisture);

  display.clearDisplay();
  display.setTextColor(SSD1306_WHITE);

  display.setTextSize(1);
  display.setCursor(0, 0);
  display.println("Light (lux):");
  display.setTextSize(2);
  display.setCursor(0, 10);
  display.println(lux, 0);

  display.setTextSize(1);
  display.setCursor(0, 36);
  display.print("Soil: ");
  display.print(moisture);
  display.println("% wet");

  display.setCursor(0, 52);
  display.print("Log #");
  display.print(totalReadings);

  display.display();
}

void loop() {
  unsigned long now = millis();

  if (totalReadings == 0 || (now - lastLog >= LOG_INTERVAL)) {
    logReading();
    lastLog = now;
  }
}
Line-by-line: what every line does and why
Lines 1–3: Borrowing the instruction books
#include <Wire.h>
#include <BH1750.h>
#include <Adafruit_SSD1306.h>
Three #include lines pull in three instruction books:
Wire.h— how to use the two-wire I2C communication system.BH1750.h— how to talk to the light sensor.Adafruit_SSD1306.h— how to draw on the OLED display.
Lines 5–8: Creating the display
#define SCREEN_WIDTH 128
#define SCREEN_HEIGHT 64
Adafruit_SSD1306 display(SCREEN_WIDTH, SCREEN_HEIGHT, &Wire, -1);
The display is 128 × 64 pixels. We give it a name — display — so we can talk to it. The -1 means no reset pin.
Line 10: Creating the light sensor
BH1750 lightMeter;We create a light sensor and name it lightMeter. From now on, lightMeter.readLightLevel() asks it “how bright is it?”
Lines 12–17: Soil sensor setup
#define SOIL_PIN PIN_SOIL
#define SOIL_DRY 3200
#define SOIL_WET 1400
The soil sensor plugs into analog pin 1 (C6: pin 3) — PIN_SOIL comes from the board block at the top. SOIL_DRY and SOIL_WET are calibration numbers — they say “when the raw reading is 3200, the soil is completely dry; when it’s 1400, it’s saturated.” You’ll find your own numbers in Step 3.
Lines 19–24: The data shelves
#define MAX_READINGS 168
float lightHistory[MAX_READINGS];
int moistureHistory[MAX_READINGS];
int readingIndex = 0;
int totalReadings = 0;
Two shelves with 168 compartments each — one for light data, one for moisture data. 168 hourly readings = 7 days. readingIndex tracks which compartment to write into next. totalReadings is the total count of all readings taken.
Line 26: How often to log
#define LOG_INTERVAL 36000003,600,000 milliseconds = 3,600 seconds = 1 hour. For testing, change this to 10000 (10 seconds). The loop() function checks this to know when it’s time to record.
Lines 35–50: setup() — morning routine
setup() runs once when you plug in the power. It starts the Serial communication, wakes up the I2C bus (Wire.begin(PIN_SDA, PIN_SCL); — SDA on leg 8, SCL on leg 9; C6: legs 6 and 7), checks that the display and light sensor responded, shows a startup message, and waits 2 seconds.
The if (!lightMeter.begin(...)) pattern means: “if the light sensor did NOT respond, show an error and stop.” The ! means NOT. This stops the program before it tries to use a missing sensor.
Lines 52–64: readMoisture() — turning raw numbers into percentages
int rawValue = analogRead(SOIL_PIN);
int moisturePercent = map(rawValue, SOIL_DRY, SOIL_WET, 0, 100);
moisturePercent = constrain(moisturePercent, 0, 100);
return moisturePercent;
analogRead(SOIL_PIN) returns a raw number between 0 and 4095. It’s like a voltage meter — it converts 0–3.3V into a 0–4095 number. The map() function rescales that range: “take this value from the DRY–WET range and convert it to the 0–100% range.” Like converting Celsius to Fahrenheit using a formula. constrain clamps the result so it never goes below 0 or above 100 (sensors can read slightly outside their calibrated range).
Lines 66–96: logReading() — takes one full measurement
float lux = lightMeter.readLightLevel();
int moisture = readMoisture();

lightHistory[readingIndex] = lux;
moistureHistory[readingIndex] = moisture;
readingIndex = (readingIndex + 1) % MAX_READINGS;
totalReadings++;
Reads both sensors. Stores the results on the shelves. The (readingIndex + 1) % MAX_READINGS trick makes the index wrap around: after compartment 167 comes compartment 0 again. It’s a circular buffer — like a clock that resets. Old readings get overwritten by new ones. totalReadings++ adds 1 to the tally.
The rest of logReading() sends the data to Serial Monitor and updates the OLED screen.
Lines 98–104: loop() — the timer
unsigned long now = millis();

if (totalReadings == 0 || (now - lastLog >= LOG_INTERVAL)) {
  logReading();
  lastLog = now;
}
millis() is a stopwatch that started at power-on. The if asks: “Have I never logged yet, OR has at least 1 hour passed since the last log?” If yes, log and write down the time. This pattern avoids delay() — the ESP32 stays awake and keeps checking the clock instead of sleeping.
The whole thing in one sentence
At power-on, the logger sets up both sensors and says hello. Then it watches the clock and every hour it reads the light and soil, adds it to the shelf, and reports the numbers over Serial — building a week-long dataset automatically.
First thing to try: Change LOG_INTERVAL to 10000 (10 seconds) and upload. Hold your hand over the light sensor — the lux reading should drop. Push the soil sensor into wet soil — the moisture should rise. You’ve verified both sensors work.
Check: Open Serial Monitor (115200 baud). You should see readings in the format:
1,450.2,67(reading number, lux, moisture%). Push the soil sensor into dry soil — the moisture should read near 0%. Put it in wet soil — it should read 50–100%.
Step 3: Calibrate the moisture sensor
Time: ~10 minutes
The raw numbers from your sensor depend on your specific board. Let’s find your real dry/wet values:
- Leave the sensor in open air. Open Serial Monitor. Read the raw value — add this print to your code temporarily:
Serial.println(analogRead(SOIL_PIN)); // Add this to loop() temporarily - That’s your DRY value. Update
#define SOIL_DRYwith your number. - Put the sensor in a cup of water. The reading drops. That’s your WET value. Update
#define SOIL_WET. - Remove the debug line. Re-upload.
Step 4: Collect and present your data
Collect: Run the logger next to your plant for 1–2 weeks. Open Serial Monitor every few days and copy the CSV data into a Google Sheet. Excel can also open CSV files.
Analyze: In your spreadsheet, make two charts:
- Light over time (lux per hour)
- Soil moisture over time
Look for patterns: Does moisture drop fast on sunny days (evaporation)? Does growth correlate with higher light hours?
Present: Show the live device, show the data table, show your charts. Explain what lux means (the sun at noon = ~100,000 lux; a cloudy day = ~10,000 lux; a dim room = ~50 lux).
What just happened
Concepts you used:
- Analog-to-digital conversion (ADC) — the sensor produces a voltage between 0V and 3.3V. The ESP32 converts that voltage to a number from 0 to 4095. This is how all analog sensors work.
- Sensor calibration — a raw reading of “2800” means nothing until you know what “dry” and “wet” look like. You calibrated your sensor.
- Scientific variables — independent (light, moisture) vs. dependent (plant height). Your device measures the independent variables automatically.
- Data logging — automated collection over time. Real plant scientists use this in climate-controlled growth chambers worldwide.
Curriculum alignment: NGSS MS-LS1-5 (Construct a scientific explanation based on evidence for how environmental and genetic factors influence the growth of organisms). Also supports MS-LS2-1 (Analyze and interpret data to provide evidence for the effects of resource availability on organisms).
Presentation tip: Show your data table to your class and ask: “Why did my plant grow 3 cm in week 2 but only 0.5 cm in week 3?” Then reveal your light data showing it was cloudy all of week 3. You’ve just demonstrated cause and effect with real evidence. That’s science.
Level Up
Two-plant comparison: Wire a second soil sensor and run both near different plants. Log them as “Plant A” and “Plant B” in your CSV. Side-by-side data is much more compelling than a single plant.
Automated watering: Add a small 5V relay module (GPIO15) to control a mini water pump. Program it: when moisture drops below 30%, turn the pump on for 3 seconds. Now you have an automatic irrigation system — like the ones used in modern farms.
Growth rate tracking: Add a simple ultrasonic sensor (HC-SR04) pointing down at the plant from above. It measures distance — as the plant grows taller, the distance decreases. Fully automated height logging.
★★ You completed: Grade 6 Plant Growth Logger!
Troubleshooting
| Problem | Fix |
|---|---|
| Moisture always reads 0% or 100% | Calibrate SOIL_DRY and SOIL_WET values as described in Step 3. Every sensor is slightly different. |
| BH1750 reads 0 lux in bright light | Check I2C wiring. Some BH1750 boards have ADDR pin that must be pulled LOW — connect ADDR to GND. |
| Sensor readings jump around | Take an average of 5 readings instead of 1. Add this: for(int i=0; i<5; i++) { raw += analogRead(SOIL_PIN); } raw /= 5; |
| Display shows garbage or nothing | Power cycle the board. Check 3.3V (not 5V) on both sensors and display. |
| Can’t export my data | Open Serial Monitor → right-click → Select All → Copy. Paste into a text file and rename it .csv. Open in Excel or Google Sheets. |