Parent info
Parts you need
Affiliate links — we may earn a small commission
Try this circuit in your browser!
Run the code, press the buttons and watch what happens — before you buy any parts. No account needed.
Open in Simulator →Your classmates collected data on paper. You built a statistics machine.
Your math class is studying statistics — mean, median, mode, range. Everyone else makes up fake numbers or measures pencils with a ruler. You walk in with a device that collected 100 real distance measurements, automatically calculated the mean and range, and displayed a bar graph showing the distribution.
You didn’t calculate anything by hand. You built a machine that does statistics.
What you’ll need
| Part | What it does | Price |
|---|---|---|
| ESP32-S3-DevKitC-1 | The brain — runs the statistics calculations | ~$12 |
| HC-SR04 ultrasonic sensor | Measures distance using sound waves — like a bat! | ~$3 |
| 0.96” OLED display | Shows live data, statistics, and bar graph | ~$5 |
| Breadboard + jumper wires | Connects everything. No soldering. | ~$5 |
| 1kΩ + 2kΩ resistors | Turn the sensor’s 5V echo signal into a safe 3.3V | ~$1 |
Total: ~$26 | Time: ~75 minutes | Difficulty: ●●○○○
What can you measure? This project uses distance as the example data. But you can swap the sensor for almost anything: a temperature sensor (measure room temperature at different spots), a light sensor (measure brightness), or even a button to count events. The statistics code works for any number.
How it works (60 seconds)
The HC-SR04 sends out a ultrasonic pulse — a sound wave too high for humans to hear — and then listens for the echo. The time it takes for the echo to return tells you exactly how far away something is (sound travels at 343 m/s, so the math is straightforward). The ESP32 takes a measurement, adds it to an array of numbers, and recalculates the mean, min, max, and range every time. It also updates a bar graph on the screen showing how the numbers are distributed. This is real-time statistics — the same concept used in quality control factories, sports analytics, and scientific research.
Step 0: Pick your experiment
Time: ~5 minutes
Before wiring, choose what you’ll measure. Here are ideas that make great stats experiments:
Option A — Distance distribution: Point the sensor at a hallway. Every time someone walks by, press a button to record their distance from the wall. After 30 people, your data shows whether people tend to walk in the middle or near the sides.
Option B — Reaction time: Hold your hand above the sensor. The device measures how close your hand is when you “catch” a falling ruler (the classic reaction time experiment). Take 20 measurements, calculate your personal mean reaction distance.
Option C — Object sorting: Place objects at different distances (5cm, 10cm, 20cm, etc.) and log them. Check that your measurements cluster around the true distances — this tests sensor accuracy.
Whatever you choose, write a hypothesis first. Stats without a question is just numbers.
Step 1: Wire it up
Time: ~10 minutes
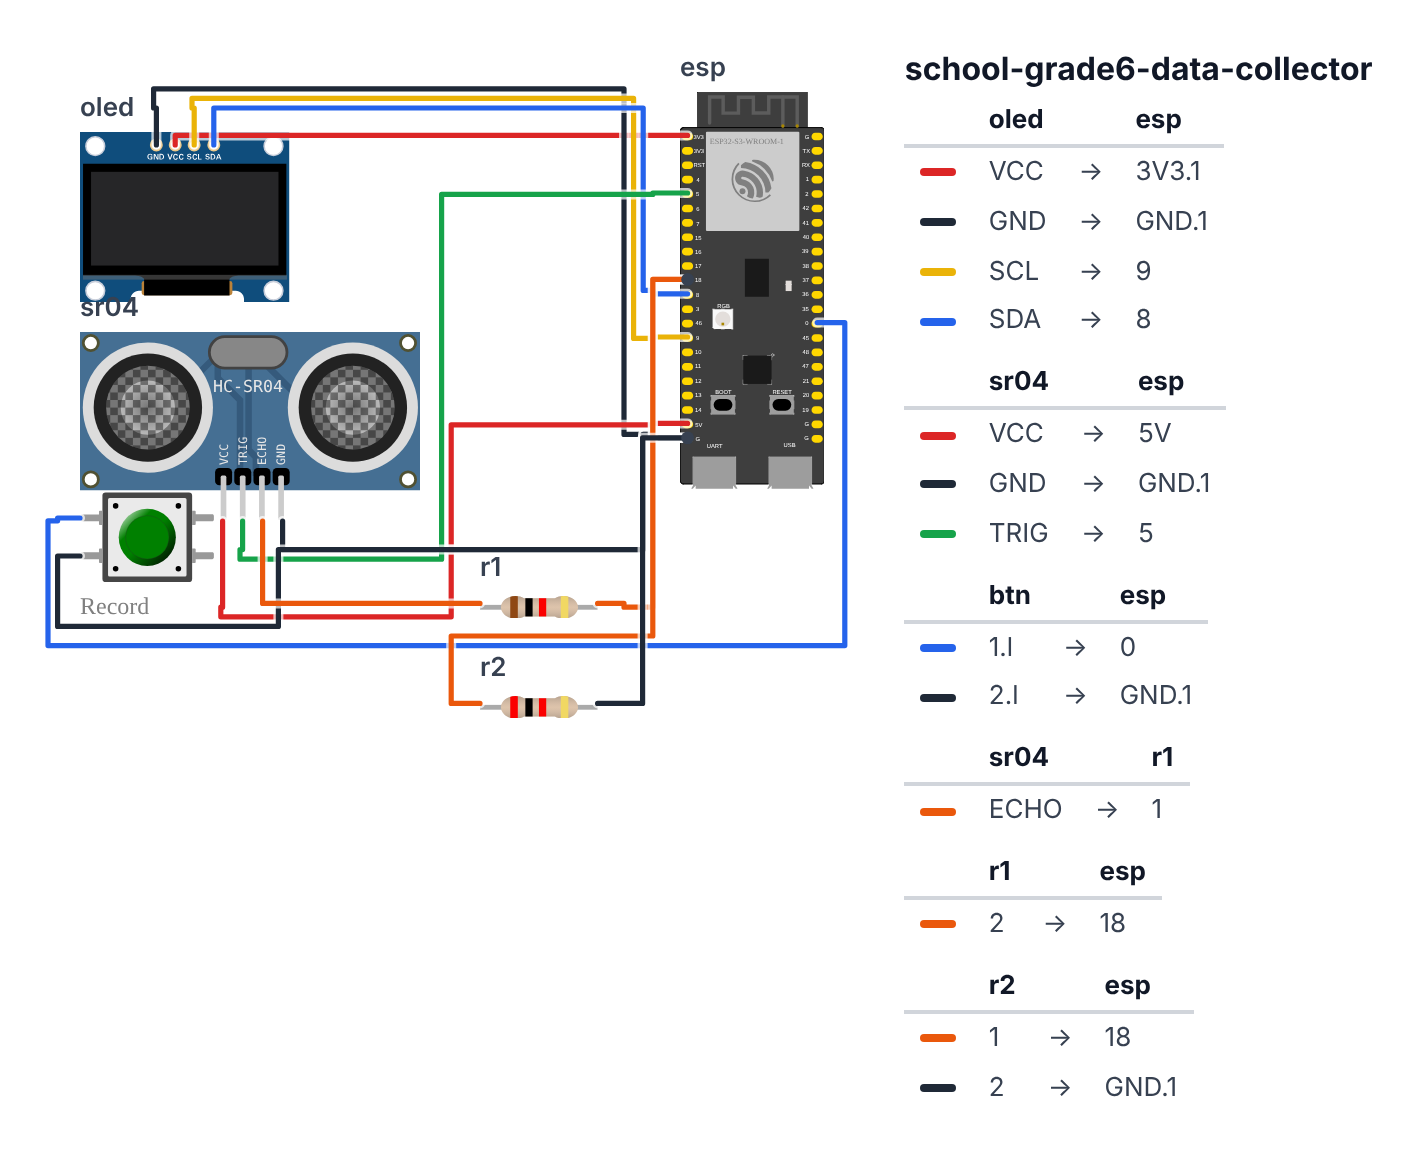
OLED Display (I2C, 4 wires):
- OLED VCC → board 3.3V — red wire
- OLED GND → board GND — black wire
- OLED SCL → board GPIO 9 (C6: GPIO 7) — yellow wire
- OLED SDA → board GPIO 8 (C6: GPIO 6) — blue wire
HC-SR04 Ultrasonic Sensor (4 wires): 5. Sensor VCC → board 5V — red wire (this sensor needs 5V, not 3.3V) 6. Sensor GND → board GND — black wire 7. Sensor TRIG → board GPIO 5 — green wire 8. Sensor ECHO → 1kΩ resistor → board GPIO 18 — orange wire 9. 2kΩ resistor from board GPIO 18 → board GND — so the 5V echo signal becomes a safe 3.3V
Check: The HC-SR04 needs 5V to work, but its ECHO pin then sends back 5V, which can damage the ESP32. The two resistors (1kΩ + 2kΩ) shrink that 5V echo signal to a safe 3.3V before it reaches GPIO 18. Don’t skip them.
Step 2: Flash the code
Time: ~20 minutes
Install Adafruit SSD1306 and Adafruit GFX libraries as in the other Grade 6 projects.
Here is the big picture. This program turns the ESP32 into a statistics machine:
- The ESP32 is the brain — it does all the math.
- The HC-SR04 is a bat sensor — it shouts a sound pulse and listens for the echo. The time it takes tells you the distance.
- The OLED display shows your growing dataset: mean, min, max, range, and a bar graph.
- Every time you press the BOOT button, the machine takes one measurement, stores it, and recalculates your statistics instantly.
A program is like a recipe. The computer reads it top to bottom. Copy this entire recipe into Arduino IDE and upload it:
// ========== CHOOSE YOUR BOARD ==========
// Uncomment the line for YOUR board:
#define BOARD_S3    // ESP32-S3-DevKitC-1
//#define BOARD_C6  // ESP32-C6-DevKitC-1
// ========================================

#ifdef BOARD_S3
  #define PIN_SDA      8
  #define PIN_SCL      9
  #define PIN_TRIG     5
  #define PIN_ECHO     18
  #define PIN_BUTTON   0
#endif
#ifdef BOARD_C6
  #define PIN_SDA      6
  #define PIN_SCL      7
  #define PIN_TRIG     5
  #define PIN_ECHO     18
  #define PIN_BUTTON   9
#endif

#include <Wire.h>
#include <Adafruit_SSD1306.h>

#define SCREEN_WIDTH 128
#define SCREEN_HEIGHT 64
Adafruit_SSD1306 display(SCREEN_WIDTH, SCREEN_HEIGHT, &Wire, -1);

#define TRIG_PIN PIN_TRIG
#define ECHO_PIN PIN_ECHO

#define MAX_DATA 100
float data[MAX_DATA];
int dataCount = 0;

float measureDistance() {
  digitalWrite(TRIG_PIN, LOW);
  delayMicroseconds(2);
  digitalWrite(TRIG_PIN, HIGH);
  delayMicroseconds(10);
  digitalWrite(TRIG_PIN, LOW);

  long duration = pulseIn(ECHO_PIN, HIGH, 30000);

  if (duration == 0) return -1;

  float distance = (duration * 0.0343) / 2.0;

  return distance;
}

float calculateMean() {
  if (dataCount == 0) return 0;
  float sum = 0;
  for (int i = 0; i < dataCount; i++) {
    sum += data[i];
  }
  return sum / dataCount;
}

float calculateMin() {
  if (dataCount == 0) return 0;
  float minVal = data[0];
  for (int i = 1; i < dataCount; i++) {
    if (data[i] < minVal) minVal = data[i];
  }
  return minVal;
}

float calculateMax() {
  if (dataCount == 0) return 0;
  float maxVal = data[0];
  for (int i = 1; i < dataCount; i++) {
    if (data[i] > maxVal) maxVal = data[i];
  }
  return maxVal;
}

void drawBarGraph(float minVal, float maxVal) {
  if (dataCount < 2) return;

  int buckets[8] = {0};
  float range = maxVal - minVal;
  if (range == 0) return;

  for (int i = 0; i < dataCount; i++) {
    int bucket = (int)((data[i] - minVal) / range * 7);
    bucket = constrain(bucket, 0, 7);
    buckets[bucket]++;
  }

  int maxBucket = 1;
  for (int i = 0; i < 8; i++) {
    if (buckets[i] > maxBucket) maxBucket = buckets[i];
  }

  for (int i = 0; i < 8; i++) {
    int barHeight = (buckets[i] * 20) / maxBucket;
    int x = i * 16;
    int y = 63 - barHeight;
    display.fillRect(x, y, 14, barHeight, SSD1306_WHITE);
  }
}

void showStats() {
  display.clearDisplay();

  if (dataCount == 0) {
    display.setTextSize(1);
    display.setTextColor(SSD1306_WHITE);
    display.setCursor(0, 0);
    display.println("Press button to");
    display.println("take a reading!");
    display.println();
    display.print("Readings: 0/");
    display.println(MAX_DATA);
    display.display();
    return;
  }

  float mean = calculateMean();
  float minVal = calculateMin();
  float maxVal = calculateMax();
  float range = maxVal - minVal;

  display.setTextColor(SSD1306_WHITE);

  display.setTextSize(1);
  display.setCursor(0, 0);
  display.print("n="); display.print(dataCount);
  display.print("  Mean:"); display.println(mean, 1);
  display.print("Min:"); display.print(minVal, 1);
  display.print(" Max:"); display.println(maxVal, 1);
  display.print("Range: "); display.print(range, 1); display.println(" cm");

  display.drawLine(0, 40, 128, 40, SSD1306_WHITE);

  if (dataCount >= 5) {
    drawBarGraph(minVal, maxVal);
  } else {
    display.setCursor(0, 44);
    display.print("Need "); display.print(5 - dataCount); display.println(" more for graph");
  }

  display.display();
}

void setup() {
  Serial.begin(115200);
  Wire.begin(PIN_SDA, PIN_SCL);

  pinMode(TRIG_PIN, OUTPUT);
  pinMode(ECHO_PIN, INPUT);

  pinMode(PIN_BUTTON, INPUT_PULLUP);

  if (!display.begin(SSD1306_SWITCHCAPVCC, 0x3C)) {
    Serial.println("Display not found!");
    while (true);
  }

  display.clearDisplay();
  display.setTextColor(SSD1306_WHITE);
  display.setTextSize(1);
  display.setCursor(0, 0);
  display.println("Stats Collector");
  display.println("Press BOOT button");
  display.println("to take readings!");
  display.display();
  delay(2000);

  showStats();

  Serial.println("Ready! Press BOOT button to collect data.");
  Serial.println("Reading #,Distance (cm)");
}

bool lastButtonState = HIGH;

void loop() {
  bool buttonState = digitalRead(PIN_BUTTON);

  if (lastButtonState == HIGH && buttonState == LOW) {
    delay(50);

    float distance = measureDistance();

    if (distance > 0 && distance < 400 && dataCount < MAX_DATA) {
      data[dataCount] = distance;
      dataCount++;

      Serial.print(dataCount);
      Serial.print(",");
      Serial.println(distance, 1);

      showStats();
    } else if (distance <= 0 || distance >= 400) {
      display.clearDisplay();
      display.setTextColor(SSD1306_WHITE);
      display.setCursor(0, 0);
      display.println("Out of range!");
      display.println("Move object closer");
      display.println("(2cm - 400cm)");
      display.display();
      delay(1500);
      showStats();
    }
  }

  lastButtonState = buttonState;
  delay(10);
}
Line-by-line: what every line does and why
Lines 1–2: Borrowing ready-made tools
#include <Wire.h>
#include <Adafruit_SSD1306.h>
#include means “grab this instruction book.” Wire is the book for two-wire communication (I2C — how the display talks to the ESP32). Adafruit_SSD1306 is the book for the OLED display.
Lines 4–6: Setting up the display
#define SCREEN_WIDTH 128
#define SCREEN_HEIGHT 64
Adafruit_SSD1306 display(SCREEN_WIDTH, SCREEN_HEIGHT, &Wire, -1);
#define gives a number a name — so the code is easier to read. The display is 128 dots wide and 64 dots tall. Then we create the display and call it display. The -1 means “no reset pin.”
Lines 8–9: Naming the sensor pins
#define TRIG_PIN PIN_TRIG
#define ECHO_PIN PIN_ECHO
The HC-SR04 sensor has two wires: TRIG (trigger — the ESP32 tells it to shout) and ECHO (the ESP32 listens for the reply). PIN_TRIG and PIN_ECHO come from the board block at the top: TRIG is connected to leg 5, ECHO to leg 18 (the same on both boards).
Lines 11–13: The data shelf
#define MAX_DATA 100
float data[MAX_DATA];
int dataCount = 0;
data[MAX_DATA] is a shelf with 100 compartments. Each compartment holds one distance measurement. dataCount is a tally: how many we’ve collected so far. It starts at 0.
Lines 15–28: measureDistance() — how the sonar works
float measureDistance() {
  digitalWrite(TRIG_PIN, LOW);
  delayMicroseconds(2);
  digitalWrite(TRIG_PIN, HIGH);
  delayMicroseconds(10);
  digitalWrite(TRIG_PIN, LOW);

  long duration = pulseIn(ECHO_PIN, HIGH, 30000);

  if (duration == 0) return -1;

  float distance = (duration * 0.0343) / 2.0;

  return distance;
}
This is a function — a small recipe with its own name. When we call measureDistance(), this whole recipe runs.
digitalWrite(TRIG_PIN, LOW)thenHIGHthenLOW— this sends a tiny 10-microsecond burst of sound. Think of it as a bat saying “click!”delayMicroseconds(2)waits 2 millionths of a second. Very short — just enough to reset the pin.pulseIn(ECHO_PIN, HIGH, 30000)— “how long did the ECHO pin stay HIGH?” That’s the time the sound took to go to the object and bounce back. The30000is the timeout: if nothing echoes back in 30ms, give up.if (duration == 0) return -1— if the sensor timed out (nothing in range), return-1as an error signal.(duration * 0.0343) / 2.0— the physics formula. Sound travels 343 meters per second (0.0343 cm per microsecond). Multiply by the travel time. But the sound went to the object AND came back, so divide by 2.
Lines 30–50: Three math functions
float calculateMean() { ... }
float calculateMin() { ... }
float calculateMax() { ... }
Three functions that loop through the data[] shelf and find things:
- Mean — add everything up, divide by the count. Your class average.
- Min — scan through all values and remember the smallest one.
- Max — same but remembers the biggest.
Each uses a for loop: “starting at compartment 0, go to the last one, check each.” The for (int i = 0; i < dataCount; i++) means: start i at 0, keep going while i is less than dataCount, add 1 to i each time. Like counting through a list.
Lines 52–80: drawBarGraph() — drawing the histogram
void drawBarGraph(float minVal, float maxVal) {
  int buckets[8] = {0};
  ...
  for (int i = 0; i < dataCount; i++) {
    int bucket = (int)((data[i] - minVal) / range * 7);
    bucket = constrain(bucket, 0, 7);
    buckets[bucket]++;
  }
  ...
}
A histogram sorts values into bins, like sorting marbles by color into 8 cups. The formula (data[i] - minVal) / range * 7 figures out which of the 8 cups each measurement goes into. constrain makes sure the result stays between 0 and 7 (no overflowing the cups). Then bars are drawn on screen proportional to how full each cup is.
Lines 82–118: showStats() — the dashboard
This function clears the screen and draws everything: count, mean, min, max, range, and the bar graph. Key line:
display.drawLine(0, 40, 128, 40, SSD1306_WHITE);Draws a horizontal line at pixel row 40 — a visual divider between the numbers at top and the bar graph at bottom.
Lines 120–150: setup() runs once
pinMode(TRIG_PIN, OUTPUT);
pinMode(ECHO_PIN, INPUT);
pinMode(PIN_BUTTON, INPUT_PULLUP);
pinMode tells the ESP32 how each leg is used:
OUTPUTmeans “I want to send signals out through this leg.”INPUTmeans “I want to listen for signals coming in.”INPUT_PULLUPmeans “listen for signals, but assume HIGH by default.” The BOOT button (leg 0; C6: leg 9) works this way — it reads HIGH (1) when not pressed, and LOW (0) when you press it.
Lines 152–184: loop() — the button handler
bool buttonState = digitalRead(PIN_BUTTON);

if (lastButtonState == HIGH && buttonState == LOW) {
  delay(50);
  float distance = measureDistance();
  ...
}
lastButtonState = buttonState;
digitalRead(PIN_BUTTON) asks: “Is the BOOT button currently pressed?” It returns HIGH (not pressed) or LOW (pressed). The if detects the moment the button goes from HIGH to LOW — that’s a fresh press, not someone holding it down. delay(50) is debounce — buttons are mechanical and sometimes bounce for a few milliseconds. Waiting 50ms ignores that noise.
The whole thing in one sentence
When powered on, the stats machine sets itself up (setup). Then it waits in a loop (loop), watching the BOOT button. Each press fires the sonar (measureDistance), stores the result, and recalculates and redraws the statistics (showStats).
First thing to try: Point the sensor at a wall about 30cm away and press the button 10 times. Then move it to 60cm and press 10 more times. The bar graph should show two clusters — one around 30 and one around 60.
Check: Open Serial Monitor (115200 baud). Press the BOOT button on your board (usually labeled BOOT or IO0; on the C6 it is GPIO 9). You should see a distance reading appear. Point the sensor at a wall ~30cm away — it should read roughly 30. The display should update with each press.
Step 3: Collect your data
Time: varies
Aim for at least 30 measurements for meaningful statistics. 100 is better.
For each measurement:
- Position whatever you’re measuring
- Press the BOOT button
- The device reads and stores automatically
When done, open Serial Monitor and copy your CSV data into a spreadsheet. You now have a real dataset.
Step 4: Analyze and present
In your spreadsheet, calculate these yourself to double-check the device:
- Mean = sum / count (your device calculated this)
- Range = max - min (your device calculated this)
- Sort the data and find the median (middle value)
Present to your class: Show the live device taking a measurement. Show the bar graph on screen. Explain what the distribution shape tells you about the data.
What just happened
Concepts you used:
- Mean, range, and data distribution — the statistics your device calculated live are the same formulas you’re learning in class. You just automated them.
- Ultrasonic ranging — bats, dolphins, and parking sensors all use the same physics: send sound, measure the echo time, calculate distance.
- Arrays and loops — your data is stored in an array. A for-loop calculates the mean. This is how all statistics software works, from Excel to Python.
- Histograms — the bar graph on the OLED is a histogram: it shows how often values fall in each range. This is one of the most important tools in statistics.
Curriculum alignment: Common Core Math 6.SP.A.1-3 (Develop understanding of statistical variability; summarize and describe distributions). Also supports 6.SP.B.4 (Display numerical data in plots on a number line, including dot plots, histograms, and box plots).
Presentation tip: Before presenting, collect 30+ measurements of something specific. Walk your class through the histogram on screen: “Most measurements cluster here — that’s the mean. But look at this outlier over here — that’s interesting. Why did that happen?” Getting your class to ask questions is the mark of a great science presentation.
Level Up
Median calculation: Add a sort function to your code and calculate the median (middle value). Compare it to the mean — if they’re very different, your data is skewed.
Button-free automatic collection: Remove the button and take a reading every second automatically. Use it to measure something that changes over time: the distance to cars passing a window, or how a pendulum swings.
Export to CSV automatically: Add a microSD card module and write every reading to a CSV file. Then plug the SD card into your computer for full dataset export.
★★ You completed: Grade 6 Data Collector!
Troubleshooting
| Problem | Fix |
|---|---|
| Distance always reads 0 or -1 | HC-SR04 needs 5V (not 3.3V). Check VCC connection. |
| Readings wildly inconsistent | The HC-SR04 needs a clear line of sight. Avoid soft/angled surfaces. Point at a flat wall. |
| Button doesn’t register | You’re using the BOOT button (GPIO 0; C6: GPIO 9). Make sure you’re pressing it (not the RESET/EN button). |
| Bar graph looks empty | You need at least 5 readings before the graph appears. Keep pressing the button. |
| Mean looks wrong | Check Serial Monitor — each line shows the individual readings. Look for obvious outliers (e.g., a 500cm reading from out-of-range). |