Parent info
Parts you need
Affiliate links — we may earn a small commission
Try this circuit in your browser!
Run the code, press the buttons and watch what happens — before you buy any parts. No account needed.
Open in Simulator →Your classmates made a poster. You built a real weather station.
Imagine this: your class is doing a unit on weather and climate. Everyone else prints out a chart from Google and pastes it on poster board. You walk in with a device you built that has been collecting temperature, humidity, and air pressure data every 5 minutes for the last 3 days — and it shows a live graph on a tiny screen.
Your teacher asks: “Where did you get this data?” You say: “My backyard. I built the sensor.”
That’s what we’re building. In about 2 hours. For about $29.
What you’ll need
| Part | What it does | Price |
|---|---|---|
| ESP32-S3-DevKitC-1 | The brain — runs the code and connects to WiFi | ~$12 |
| BME280 sensor module | Measures temperature, humidity, AND air pressure in one tiny chip | ~$7 |
| 0.96” OLED display | Shows live readings on a small screen | ~$5 |
| Breadboard + jumper wires | Connects everything. No soldering needed. | ~$5 |
| USB-C data cable | Connects board to your computer | ~$5 |
Total: ~$34 | Time: ~2 hours | Difficulty: ●●○○○
What’s BME280? It’s a sensor made by Bosch (the same company that makes car parts) that measures three things at once: temperature (±0.5°C accuracy), relative humidity (±3% accuracy), and barometric pressure. Real weather stations use professional versions of this same technology.
How it works (60 seconds)
Think of the BME280 like a tiny version of the weather instruments at an airport. It measures the air around it and turns those measurements into numbers. The ESP32 reads those numbers, stores them in a list, and shows them on the OLED screen. When connected to WiFi, it also sends the data to a free dashboard website so you can check your weather from anywhere.
The key concept: sensors convert physical things (temperature, humidity) into electrical signals → the microcontroller reads those signals → software turns them into useful information. This exact pipeline is used in every weather app on your phone.
Step 0: Understand the project first
Time: ~10 minutes
Before wiring anything, let’s understand what each reading means:
- Temperature — measured in Celsius. The BME280 is accurate to about ±0.5°C, which is better than most cheap thermometers.
- Relative humidity — percentage of water vapor in the air. 100% = fog or rain. Below 30% = uncomfortably dry.
- Barometric pressure — measured in hPa (hectopascals). Standard sea-level pressure is ~1013 hPa. When pressure drops fast, a storm is coming. When it rises, clear skies are ahead.
Your science fair hypothesis could be: “Does air pressure decrease before it rains?” Collect 3 days of data and find out. Real meteorologists discovered this pattern in the 1600s. You’ll rediscover it yourself.
Step 1: Wire it up
Time: ~15 minutes
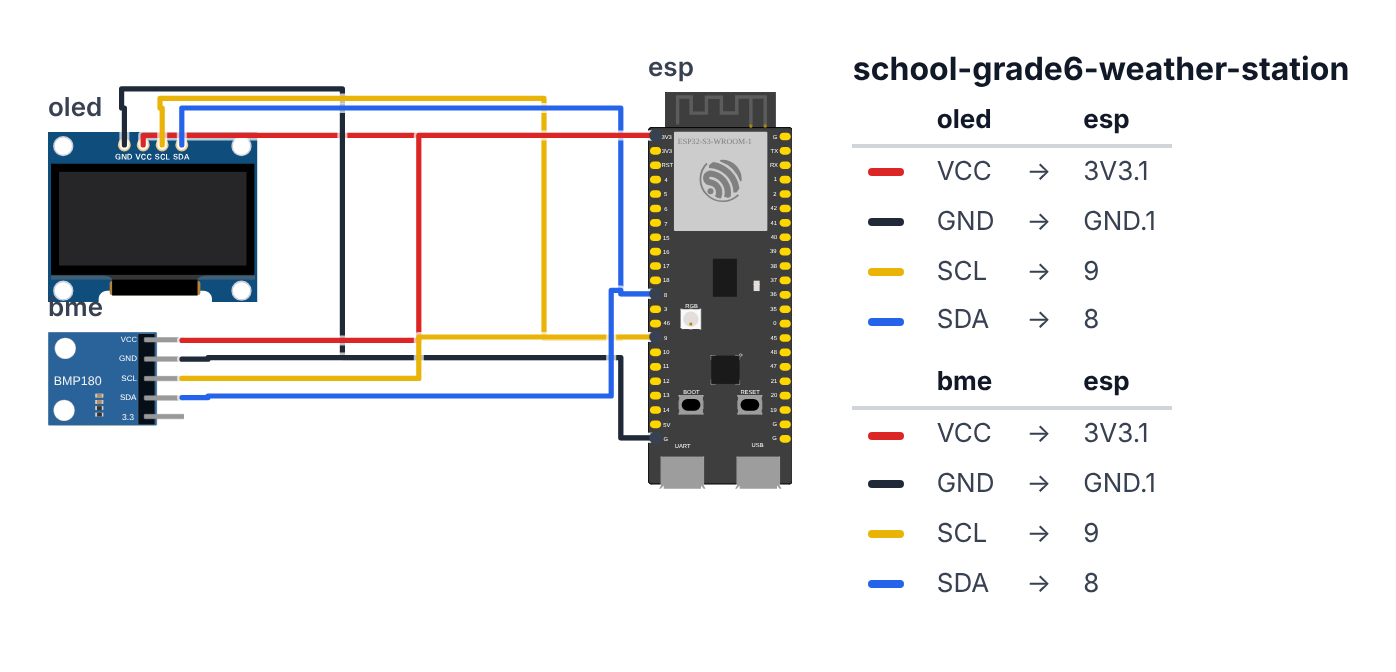
Both the BME280 and the OLED display use a communication protocol called I2C — they share the same two data wires. This means fewer wires total.
OLED Display (4 wires):
- OLED VCC → board 3.3V — red wire
- OLED GND → board GND — black wire
- OLED SCL → board GPIO 9 (C6: GPIO 7) — yellow wire
- OLED SDA → board GPIO 8 (C6: GPIO 6) — blue wire
BME280 Sensor (4 wires — shares power and I2C bus): 5. BME280 VCC → board 3.3V — red wire (same rail as OLED) 6. BME280 GND → board GND — black wire (same rail as OLED) 7. BME280 SCL → board GPIO 9 (C6: GPIO 7) — yellow wire (same wire as OLED SCL) 8. BME280 SDA → board GPIO 8 (C6: GPIO 6) — blue wire (same wire as OLED SDA)
Check: You should have 4 unique wires going from your breadboard to the board (3.3V, GND, GPIO 9, GPIO 8 — on the C6: GPIO 7, GPIO 6), and each sensor plugged into those same rails. Both sensors share the power and I2C lines — that’s the magic of I2C.
Common mistake: Using GPIO 8 (SDA) and GPIO 9 (SCL) is the standard I2C on the ESP32-S3 (on the ESP32-C6 it’s GPIO 6 and GPIO 7). If your specific board labels them differently, look for pins marked SDA and SCL.
Step 2: Flash the code
Time: ~20 minutes
Open Arduino IDE. Go to File → Preferences and add this URL to “Additional Board Manager URLs”:
https://raw.githubusercontent.com/espressif/arduino-esp32/gh-pages/package_esp32_index.json
Then: Tools → Board → Boards Manager → search “esp32” → install “esp32 by Espressif Systems.”
Install these libraries via Tools → Manage Libraries:
Adafruit BME280 Libraryby AdafruitAdafruit SSD1306by AdafruitAdafruit GFX Libraryby Adafruit
Select board: Tools → Board → ESP32 Arduino → ESP32S3 Dev Module
The big picture first. This program turns the ESP32 into a tiny weather station:
- The ESP32 is a small computer, smaller than a matchbox. It’s the “brain” of the station.
- The BME280 is a tiny sensor that measures temperature, humidity, and air pressure. It’s the “eyes and nose.”
- The OLED display is a small screen that shows the numbers.
A program is like a recipe. The computer reads it top to bottom and does exactly what’s written, nothing more. Copy this entire recipe into Arduino IDE and upload it:
// ========== CHOOSE YOUR BOARD ==========
// Uncomment the line for YOUR board:
#define BOARD_S3    // ESP32-S3-DevKitC-1
//#define BOARD_C6  // ESP32-C6-DevKitC-1
// ========================================

#ifdef BOARD_S3
  #define PIN_SDA   8
  #define PIN_SCL   9
#endif
#ifdef BOARD_C6
  #define PIN_SDA   6
  #define PIN_SCL   7
#endif

#include <Wire.h>
#include <Adafruit_BME280.h>
#include <Adafruit_SSD1306.h>

#define SCREEN_WIDTH 128
#define SCREEN_HEIGHT 64
Adafruit_SSD1306 display(SCREEN_WIDTH, SCREEN_HEIGHT, &Wire, -1);

Adafruit_BME280 bme;

float tempHistory[60];
float humidHistory[60];
float pressHistory[60];
int readingCount = 0;

#define LOG_INTERVAL 300000
unsigned long lastReading = 0;

void setup() {
  Serial.begin(115200);
  Wire.begin(PIN_SDA, PIN_SCL);

  if (!display.begin(SSD1306_SWITCHCAPVCC, 0x3C)) {
    Serial.println("OLED not found!");
    while (true);
  }

  if (!bme.begin(0x76)) {
    display.clearDisplay();
    display.setTextSize(1);
    display.setTextColor(SSD1306_WHITE);
    display.setCursor(0, 0);
    display.println("BME280 not found!");
    display.println("Try 0x77 in code");
    display.display();
    while (true);
  }

  display.clearDisplay();
  display.setTextSize(1);
  display.setTextColor(SSD1306_WHITE);
  display.setCursor(0, 0);
  display.println("Weather Station");
  display.println("Starting up...");
  display.display();
  delay(2000);
}

void takeReading() {
  float temp = bme.readTemperature();
  float humidity = bme.readHumidity();
  float pressure = bme.readPressure() / 100.0;

  int index = readingCount % 60;
  tempHistory[index] = temp;
  humidHistory[index] = humidity;
  pressHistory[index] = pressure;
  readingCount++;

  Serial.print("Temp: "); Serial.print(temp); Serial.println(" C");
  Serial.print("Humidity: "); Serial.print(humidity); Serial.println(" %");
  Serial.print("Pressure: "); Serial.print(pressure); Serial.println(" hPa");
  Serial.println("---");

  showReading(temp, humidity, pressure);
}

void showReading(float temp, float humidity, float pressure) {
  display.clearDisplay();
  display.setTextColor(SSD1306_WHITE);

  display.setTextSize(2);
  display.setCursor(0, 0);
  display.print(temp, 1);
  display.println(" C");

  display.setTextSize(1);
  display.setCursor(0, 32);
  display.print("Humidity: ");
  display.print(humidity, 0);
  display.println("%");

  display.setCursor(0, 44);
  display.print("Pressure: ");
  display.print(pressure, 0);
  display.println(" hPa");

  display.setCursor(0, 56);
  display.print("Readings: ");
  display.print(readingCount);

  display.display();
}

void loop() {
  unsigned long now = millis();
  if (readingCount == 0 || (now - lastReading >= LOG_INTERVAL)) {
    takeReading();
    lastReading = now;
  }
}
Line-by-line: what every line does and why
Lines 1–3: Borrowing ready-made tools
#include <Wire.h>
#include <Adafruit_BME280.h>
#include <Adafruit_SSD1306.h>
#include means “grab this instruction book.” Someone already wrote how to talk to the sensor and the display, so we don’t have to figure it out ourselves.
- Wire is the instruction book for how parts talk over two tiny wires. This method is called I2C.
- Adafruit_BME280 is the instruction book for the weather sensor.
- Adafruit_SSD1306 is the instruction book for the display.
Lines 5–8: Setting up the display
#define SCREEN_WIDTH 128
#define SCREEN_HEIGHT 64
#define gives a number a name. The display is 128 dots wide and 64 dots tall. Those dots are called pixels. Instead of writing the number 128 everywhere, we write SCREEN_WIDTH — it’s easier to read.
Adafruit_SSD1306 display(SCREEN_WIDTH, SCREEN_HEIGHT, &Wire, -1);Here we create the display and give it the name display. It’s like naming a dog so you can call it. We tell it how big it is, that it talks through Wire (two wires), and -1 means “I don’t have a reset button.”
Line 10: Creating the sensor
Adafruit_BME280 bme;The sensor gets the name bme. From now on, when we write bme.something, we’re talking to the sensor.
Lines 12–16: Boxes for remembering
float tempHistory[60];
float humidHistory[60];
float pressHistory[60];
Imagine a shelf with 60 compartments. Each compartment holds one number. We have three shelves like this: for temperatures, humidities, and pressures. The word float means the numbers can have a decimal point, like 23.5.
int readingCount = 0;This is a tally counter, like marks on a piece of paper. It says how many times we’ve measured so far. It starts at 0. int means a whole number, no decimal point.
Lines 18–19: How often to measure
#define LOG_INTERVAL 300000The computer counts time in milliseconds. One second is 1,000 milliseconds. 300,000 milliseconds is 300 seconds, which is 5 minutes. That’s how long the station waits between measurements. Tip: while testing, change this to 10000 (10 seconds) so you don’t have to wait forever.
unsigned long lastReading = 0;This is where the station writes down when it last measured. It’s like a sticky note that says “I last checked at…”
Lines 21–47: setup() runs once when you power on
void setup() { ... } is the morning routine. It runs only once, when you turn the ESP32 on. Everything between the curly braces { and } belongs to it.
Serial.begin(115200);Turn on the “phone line” to your computer through the USB cable. 115200 is the speed of talking. In Arduino IDE (Serial Monitor), you must set the same number — otherwise you’ll see scrambled letters.
Wire.begin(PIN_SDA, PIN_SCL);Tell the ESP32 which legs (pins) have the two wires going to the sensor and display. PIN_SDA and PIN_SCL come from the board block at the top. Pin 8 (C6: pin 6) is called SDA and carries data. Pin 9 (C6: pin 7) is called SCL and keeps the beat, like a metronome.
if (!display.begin(SSD1306_SWITCHCAPVCC, 0x3C)) {if means “if.” Here we’re asking: “Display, are you there?” The number 0x3C is the display’s address, like a house number on a street. You can connect multiple parts to the same pair of wires, and each one has its own house number. The exclamation mark ! means “NOT.” So the whole thing reads: “If the display did NOT respond…”
    Serial.println("OLED not found!");
    while (true);
…send a message to the computer: “Display not found!” Then while (true) means “go around in circles, forever.” The program stops here on purpose. A weather station without a screen is pointless, so it’s better to just stop.
if (!bme.begin(0x76)) {Same thing for the sensor: “Sensor at address 0x76, are you there?” If not…
    display.clearDisplay();
    display.setTextSize(1);
    display.setTextColor(SSD1306_WHITE);
    display.setCursor(0, 0);
    display.println("BME280 not found!");
    display.println("Try 0x77 in code");
    display.display();
    while (true);
…write the error directly on the display. Step by step:
clearDisplay()wipes the board clean.setTextSize(1)sets small text.setTextColor(WHITE)sets white text.setCursor(0, 0)starts writing in the top-left corner. First number is horizontal, second is vertical.println(...)writes a line of text.display()actually shows it on screen. (More on this below.)while (true)stops the program again.
display.clearDisplay();
...
display.println("Weather Station");
display.println("Starting up...");
display.display();
If everything works, it shows a welcome message: “Weather Station, Starting up…”
delay(2000);Wait 2 seconds (2,000 milliseconds) so you have time to read the welcome message.
Lines 49–67: takeReading() takes one measurement
This is a function — a small recipe with its own name. Whenever we write takeReading() somewhere, this entire recipe runs.
float temp = bme.readTemperature();“Sensor, what’s the temperature?” The answer (for example 22.7 °C) goes into a box named temp.
float humidity = bme.readHumidity();“What’s the humidity?” It’s a number from 0 to 100%. Below 30% the air feels dry. Above 70% it feels sticky.
float pressure = bme.readPressure() / 100.0;“What’s the air pressure?” The sensor answers in pascals, but weather people use hectopascals. So we divide by 100. Normal pressure at sea level is about 1013 hPa. This is the most interesting number for your science project — when pressure drops fast, a storm is coming. Meteorologists figured this out in the 1600s. You’re about to rediscover it yourself.
int index = readingCount % 60;Here’s a neat trick. The % sign means “remainder after dividing.” It works like a clock: after 12 comes 1 again. Here, after compartment 59 comes compartment 0 again.
- 5th reading: 5 % 60 = 5
- 61st reading: 61 % 60 = 1
The shelf never overflows. The oldest number simply gets overwritten by the newest.
tempHistory[index] = temp;
humidHistory[index] = humidity;
pressHistory[index] = pressure;
Put the measured numbers into the shelves, into compartment number index.
readingCount++;++ means “add 1.” Another mark on the tally paper.
Serial.print("Temp: "); Serial.print(temp); Serial.println(" C");
...
Serial.println("---");
Send the results to your computer. The difference between the commands:
printwrites on the same line.printlnwrites and then jumps to a new line (like pressing Enter).
You can copy these numbers into a spreadsheet and make a graph for your science project.
showReading(temp, humidity, pressure);Call another recipe that shows the numbers on the display. We hand it three numbers in the parentheses, like passing three sticky notes to a friend.
Lines 69–90: showReading() draws the screen
display.clearDisplay();Wipe the screen clean. Without this, new text draws on top of old text and you get a mess.
display.setTextSize(2);
display.setCursor(0, 0);
display.print(temp, 1);
display.println(" C");
Write the temperature in big text (size 2) at the top-left. The number 1 in print(temp, 1) means one decimal place — so “23.5”, not “23.50000”.
display.setTextSize(1);
display.setCursor(0, 32);
display.print("Humidity: ");
display.print(humidity, 0);
display.println("%");
Write humidity in small text, 32 pixels lower. The 0 means no decimal places — “67%” is easier to read than “67.32%”.
display.setCursor(0, 44);
... "Pressure: " ...
display.setCursor(0, 56);
... "Readings: " ...
Even lower (44 pixels down) it writes pressure, and at the very bottom (56 pixels) the reading count. That’s proof for your teacher that the station was actually working.
display.display();The most important line! Everything before this was drawn only “in memory” — like drawing on a piece of paper hidden inside a drawer. display() pulls that paper out and shows it on the screen. If you forget this line, the screen stays black. This is the most common beginner mistake.
Lines 92–97: loop() repeats forever
void loop() is like a heartbeat: it beats over and over, thousands of times per second, as long as the ESP32 is powered on.
unsigned long now = millis();millis() is a stopwatch that started when you plugged in the power. We check how many milliseconds are on it right now and save that into now.
if (readingCount == 0 || (now - lastReading >= LOG_INTERVAL)) {Read this like a question: “If I’ve never measured yet, OR if at least 5 minutes have passed since the last measurement…”
==means “is it equal?” (a question, not a command)||means ORnow - lastReadingis the time now minus the time of the last measurement — in other words, how much time has passed>=means “greater than or equal to”
    takeReading();
    lastReading = now;
…then take a measurement and stick a new sticky note on the wall: “I last measured just now.”
Why not just use delay(300000)? Because delay is like falling asleep: the ESP32 would do absolutely nothing for 5 minutes. With millis(), it just keeps glancing at the clock (“Is it time yet? Not yet…”) and in the meantime, it could do other things too — like blink an LED or wait for a button press.
The whole thing in one sentence
When powered on, the station checks the display and sensor and says hello (setup). Then it keeps looking at the clock over and over (loop), and every 5 minutes it measures the weather (takeReading), remembers it, and shows it on screen (showReading).
First thing to try: change 300000 to 10000 and upload the code. The station will measure every 10 seconds. Then breathe on the sensor and watch the humidity and temperature climb.
Check: Open Tools → Serial Monitor, set baud to 115200. You should see temperature, humidity, and pressure values printing every few seconds during testing. The OLED should show live readings.
Step 3: Calibrate and record
Time: ~5 minutes
- Let the device run for 5 minutes to stabilize (sensors need warm-up time).
- Compare the temperature to a regular thermometer — they should be within 1-2°C.
- Change
LOG_INTERVALto300000(5 minutes) for actual data collection, or keep it at a smaller number during testing.
For your science project: Run the station for at least 3 days. Open Serial Monitor each day and copy the readings into a Google Sheet. Look for patterns: Does humidity go up at night? Does pressure change before rain?
Step 4: Present your data
Time: varies
Connect to Serial Monitor before your presentation. Show your teacher the live readings. Then show your logged data table and graph.
Key talking points:
- “This is real data I collected from [location] over [X] days.”
- “The BME280 sensor is accurate to ±0.5°C — more accurate than most home thermometers.”
- “I noticed pressure dropped before [specific weather event] — which matches what meteorologists know.”
What just happened
You just built a working environmental monitoring system — the same type of system used in airport weather stations, climate research, and smart home devices.
Concepts you used:
- I2C communication protocol — a standard way for chips to talk to each other using just two wires. Used in almost every electronic device.
- Sensor calibration — understanding accuracy, error ranges, and how to verify data.
- Data logging — automatically recording measurements over time. This is the foundation of all scientific experiments.
- Barometric pressure — air pressure changes predict weather. This is why weather apps say “pressure falling = storm coming.”
Curriculum alignment: NGSS MS-ESS2-5 (Collect data to provide evidence for how the motions and complex interactions of air masses result in changes in weather conditions). Also supports MS-ESS3-5 (climate data analysis).
Presentation tip: Bring the live device to your presentation. Showing real-time sensor data is 10× more impressive than a poster. Say: “Let me show you the current reading” and watch heads turn. Bonus: show your pressure data from the past few days and ask your class to predict tomorrow’s weather.
Level Up: Weather Station v2
Ready for the real deal? This version does everything v1 does, plus:
- Finds sensors by itself — no more editing I2C addresses. It tries 0x3C/0x3D for the display and 0x76/0x77 for the sensor.
- Blinks errors in a secret code on the board’s own RGB LED — 2 red blinks = screen missing, 3 red blinks = sensor missing. Fix the wire and it starts by itself, no restart needed.
- CSV output — every reading is one line like
12.5,23.4,48.2,1012.6. Copy from Serial Monitor into Google Sheets → Data → Split text to columns → comma. Instant spreadsheet. - Temperature graph — shows the last 60 readings as a line chart on the OLED. The scale adjusts itself.
- Weather forecast — compares pressure now vs 3 hours ago. Falling = ↓ worse soon. Rising = ↑ getting nice.
- More accurate temperature — the sensor sleeps between readings so it doesn’t warm itself up.
- Crash-proof — if a wire wiggles loose mid-reading, it skips the bad data instead of crashing.
Replace your v1 code with this. Same wiring, no changes needed:
// ========== CHOOSE YOUR BOARD ==========
// Uncomment the line for YOUR board:
#define BOARD_S3    // ESP32-S3-DevKitC-1
//#define BOARD_C6  // ESP32-C6-DevKitC-1
// ========================================

#ifdef BOARD_S3
  #define PIN_SDA       8
  #define PIN_SCL       9
  #define PIN_BOARD_RGB 38
#endif
#ifdef BOARD_C6
  #define PIN_SDA       6
  #define PIN_SCL       7
  #define PIN_BOARD_RGB 8
#endif

#include <Wire.h>
#include <Adafruit_BME280.h>
#include <Adafruit_SSD1306.h>

#define SCREEN_WIDTH 128
#define SCREEN_HEIGHT 64
#define LOG_INTERVAL 300000
#define SCREEN_SWITCH_MS 5000
#define HISTORY_SIZE 60

Adafruit_SSD1306 display(SCREEN_WIDTH, SCREEN_HEIGHT, &Wire, -1);
Adafruit_BME280 bme;

float tempHistory[HISTORY_SIZE];
float humidHistory[HISTORY_SIZE];
float pressHistory[HISTORY_SIZE];
int readingCount = 0;

float lastTemp = 0, lastHumidity = 0, lastPressure = 0;
float maxTemp = -1000, minTemp = 1000;
float maxTempAt = 0, minTempAt = 0;

unsigned long lastReading = 0;
bool firstReadingDone = false;
unsigned long lastScreenSwitch = 0;
int screenNumber = 0;

bool i2cFound(uint8_t address) {
  Wire.beginTransmission(address);
  return Wire.endTransmission() == 0;
}

void blinkError(int times) {
  for (int i = 0; i < times; i++) {
    rgbLedWrite(PIN_BOARD_RGB, 64, 0, 0);   // red
    delay(150);
    rgbLedWrite(PIN_BOARD_RGB, 0, 0, 0);    // off
    delay(150);
  }
  delay(700);
}

float minutesSinceStart() {
  return millis() / 60000.0;
}

float historyAt(float history[], int i) {
  int stored = min(readingCount, HISTORY_SIZE);
  int oldest = readingCount - stored;
  return history[(oldest + i) % HISTORY_SIZE];
}

void setup() {
  Serial.begin(115200);
  Wire.begin(PIN_SDA, PIN_SCL);

  uint8_t screenAddress = 0;
  while (screenAddress == 0) {
    if (i2cFound(0x3C)) screenAddress = 0x3C;
    else if (i2cFound(0x3D)) screenAddress = 0x3D;
    else {
      Serial.println("Screen not found! Check the 4 wires. Trying again...");
      blinkError(2);
    }
  }
  display.begin(SSD1306_SWITCHCAPVCC, screenAddress, true, false);
  display.cp437(true);
  display.setTextColor(SSD1306_WHITE);

  while (!bme.begin(0x76) && !bme.begin(0x77)) {
    display.clearDisplay();
    display.setTextSize(1);
    display.setCursor(0, 0);
    display.println("BME280 not found!");
    display.println("Check SDA, SCL,");
    display.println("3V3 and GND wires.");
    display.println();
    display.println("Trying again...");
    display.display();
    Serial.println("BME280 not found! Trying again...");
    blinkError(3);
  }

  bme.setSampling(Adafruit_BME280::MODE_FORCED,
                  Adafruit_BME280::SAMPLING_X1,
                  Adafruit_BME280::SAMPLING_X1,
                  Adafruit_BME280::SAMPLING_X1,
                  Adafruit_BME280::FILTER_OFF);

  Serial.println("minutes,temp_C,humidity_pct,pressure_hPa");

  display.clearDisplay();
  display.setTextSize(1);
  display.setCursor(0, 0);
  display.println("Weather Station v2");
  display.println();
  display.println("All parts found!");
  display.println("Starting up...");
  display.display();
  delay(2000);
}

void takeReading() {
  if (!bme.takeForcedMeasurement()) {
    Serial.println("# Measurement failed, will try again next time");
    return;
  }

  float temp = bme.readTemperature();
  float humidity = bme.readHumidity();
  float pressure = bme.readPressure() / 100.0;

  if (isnan(temp) || isnan(humidity) || isnan(pressure)) {
    Serial.println("# Strange reading, skipped");
    return;
  }

  int index = readingCount % HISTORY_SIZE;
  tempHistory[index] = temp;
  humidHistory[index] = humidity;
  pressHistory[index] = pressure;
  readingCount++;

  lastTemp = temp;
  lastHumidity = humidity;
  lastPressure = pressure;

  float now = minutesSinceStart();
  if (temp > maxTemp) { maxTemp = temp; maxTempAt = now; }
  if (temp < minTemp) { minTemp = temp; minTempAt = now; }

  Serial.print(now, 1);       Serial.print(",");
  Serial.print(temp, 2);      Serial.print(",");
  Serial.print(humidity, 1);  Serial.print(",");
  Serial.println(pressure, 2);
}

int pressureTrend() {
  const unsigned long THREE_HOURS = 3UL * 60 * 60 * 1000;
  int stepsBack = THREE_HOURS / LOG_INTERVAL;
  if (stepsBack > HISTORY_SIZE - 1) stepsBack = HISTORY_SIZE - 1;
  if (stepsBack < 1) stepsBack = 1;

  if (readingCount <= stepsBack) return 99;

  float newest = pressHistory[(readingCount - 1) % HISTORY_SIZE];
  float older  = pressHistory[(readingCount - 1 - stepsBack) % HISTORY_SIZE];
  float change = newest - older;

  float limit = 1.0 * stepsBack * LOG_INTERVAL / THREE_HOURS;

  if (change < -limit) return -1;
  if (change > limit) return 1;
  return 0;
}

void drawNumbers() {
  display.clearDisplay();

  display.setTextSize(2);
  display.setCursor(0, 0);
  display.print(lastTemp, 1);
  display.write(248);
  display.print("C");

  display.setTextSize(1);
  display.setCursor(0, 20);
  display.print("Humidity: ");
  display.print(lastHumidity, 0);
  display.print("%");

  display.setCursor(0, 30);
  display.print("Pressure: ");
  display.print(lastPressure, 0);
  display.print(" hPa");

  display.setCursor(0, 40);
  display.print("Trend: ");
  int trend = pressureTrend();
  if (trend == -1)     { display.write(25); display.print(" worse soon"); }
  else if (trend == 1) { display.write(24); display.print(" getting nice"); }
  else if (trend == 0) { display.write(26); display.print(" no change"); }
  else                 { display.print("wait 3 hours"); }

  display.setCursor(0, 54);
  display.print("Hi ");
  display.print(maxTemp, 1);
  display.print("  Lo ");
  display.print(minTemp, 1);

  display.display();
}

void drawGraph() {
  display.clearDisplay();
  display.setTextSize(1);
  display.setCursor(0, 0);

  int count = min(readingCount, HISTORY_SIZE);
  if (count < 2) {
    display.println("Graph");
    display.println();
    display.println("Needs at least");
    display.println("2 readings...");
    display.display();
    return;
  }

  float low = historyAt(tempHistory, 0);
  float high = low;
  for (int i = 1; i < count; i++) {
    float t = historyAt(tempHistory, i);
    if (t < low) low = t;
    if (t > high) high = t;
  }
  if (high - low < 1.0) {
    float middle = (high + low) / 2;
    low = middle - 0.5;
    high = middle + 0.5;
  }

  display.print("Temp ");
  display.print(low, 1);
  display.print(" - ");
  display.print(high, 1);
  display.write(248);
  display.print("C");

  const int TOP = 12, BOTTOM = 63;
  int prevX = 0, prevY = 0;
  for (int i = 0; i < count; i++) {
    float t = historyAt(tempHistory, i);
    int x = i * 2;
    int y = BOTTOM - (int)((t - low) / (high - low) * (BOTTOM - TOP));
    if (i > 0) display.drawLine(prevX, prevY, x, y, SSD1306_WHITE);
    prevX = x;
    prevY = y;
  }

  display.display();
}

void showScreen() {
  if (readingCount == 0) return;
  if (screenNumber == 0) drawNumbers();
  else drawGraph();
}

void loop() {
  unsigned long now = millis();

  if (!firstReadingDone || now - lastReading >= LOG_INTERVAL) {
    firstReadingDone = true;
    lastReading = now;
    takeReading();
    showScreen();
  }

  if (now - lastScreenSwitch >= SCREEN_SWITCH_MS) {
    lastScreenSwitch = now;
    screenNumber = 1 - screenNumber;
    showScreen();
  }
}
Line-by-line: what’s new in v2
i2cFound() — knocking on doors
bool i2cFound(uint8_t address) {
  Wire.beginTransmission(address);
  return Wire.endTransmission() == 0;
}
Think of I2C like a street with numbered houses. beginTransmission(0x3C) is knocking on door number 0x3C. endTransmission() checks if anyone opened — it returns 0 for “yes, someone lives here” and something else for “empty house.” This function tries an address and tells you true or false. The setup() uses it to try both possible addresses for the screen and sensor, so the code works no matter which version you bought.
Circular history — a shelf that loops
int index = readingCount % HISTORY_SIZE;
tempHistory[index] = temp;
% is the remainder operator — like a clock. After 59 comes 0 again (because 60 % 60 = 0). So we have a shelf with 60 slots, and we keep writing in a circle: slot 0, 1, 2, … 59, 0, 1, 2 … The oldest data gets overwritten by the newest, but we always have the last 60 readings. This trick is called a circular buffer and it’s used everywhere — from music players (buffering audio) to network routers (storing packets).
pressureTrend() — predicting the weather
float newest = pressHistory[(readingCount - 1) % HISTORY_SIZE];
float older  = pressHistory[(readingCount - 1 - stepsBack) % HISTORY_SIZE];
float change = newest - older;
Real meteorologists use exactly this trick: compare the air pressure now to what it was 3 hours ago. If it dropped more than 1 hPa, bad weather is likely coming (clouds, rain). If it rose, clearing up. The function calculates stepsBack — how many readings fit in 3 hours (36 at one reading per 5 minutes). Then it grabs the newest and the oldest pressure from the circular buffer and subtracts them.
drawGraph() — drawing a line chart on a tiny screen
int y = BOTTOM - (int)((t - low) / (high - low) * (BOTTOM - TOP));
if (i > 0) display.drawLine(prevX, prevY, x, y, SSD1306_WHITE);
This is the formula that turns a temperature into a pixel position. (t - low) / (high - low) gives a number between 0 and 1 — how far this temperature is between the lowest and highest. Multiply by the screen height and subtract from BOTTOM (because y=0 is the top of the screen, not the bottom — screens are upside-down compared to math graphs). Then drawLine() connects each point to the previous one, creating a line chart.
MODE_FORCED — a sleeping sensor
bme.setSampling(Adafruit_BME280::MODE_FORCED, ...);In normal mode, the BME280 measures continuously — hundreds of times per second. But continuous measuring generates heat inside the chip, which makes the temperature reading 1-2°C too high. In forced mode, the sensor sleeps between measurements. We wake it up with takeForcedMeasurement(), it measures once, and goes back to sleep. Cooler chip = more accurate temperature.
The screen flip trick
screenNumber = 1 - screenNumber; // 0 becomes 1, 1 becomes 0This is a clever one-liner. If screenNumber is 0, then 1 - 0 = 1. If it’s 1, then 1 - 1 = 0. It flips between two values without needing an if statement. Used everywhere in programming when you need to toggle between two states.
First thing to try: Change LOG_INTERVAL to 10000 (10 seconds) and breathe on the sensor a few times. Watch the temperature line climb on the graph screen, then drop back down when you stop. You just saw real-time data visualization on hardware you built.
Note: The error blinks use the board’s own RGB LED (the tiny color LED soldered on the board), so there’s nothing extra to wire. It sits on GPIO 38 (C6: GPIO 8). It’s a color LED, so
digitalWritecan’t switch it:rgbLedWrite(PIN_BOARD_RGB, 64, 0, 0)turns it red andrgbLedWrite(PIN_BOARD_RGB, 0, 0, 0)turns it off. Very early S3 boards (v1.0) have this LED on GPIO 48. If yours doesn’t blink, change38to48, or just watch the Serial Monitor for error messages.
★★ You completed: Weather Station v2!
Troubleshooting
| Problem | Fix |
|---|---|
| BME280 not found | v2 tries both 0x76 and 0x77 automatically. If it still fails, check SDA/SCL wires. RGB LED blinks red 3 times = sensor problem. |
| OLED stays blank | v2 tries both 0x3C and 0x3D automatically. Check 3.3V (not 5V) on VCC. RGB LED blinks red 2 times = screen problem. |
| Temperature reads too high | Move the BME280 a few centimeters away from the ESP32 on longer wires. v2 uses forced mode which helps, but physical distance helps more. |
| Serial Monitor shows garbage | Make sure baud rate is set to 115200 in Serial Monitor (bottom dropdown). |
| Board not recognized by Arduino IDE | Install CP210x or CH340 USB driver (depends on your board). Google your exact board model + “driver.” |
| Graph shows “Needs at least 2 readings” | Wait for two measurement cycles. With LOG_INTERVAL 10000 that’s 20 seconds. |
| Forecast says “wait 3 hours” forever | With 10-second test interval, it only needs ~10 minutes of data. With 5-minute interval, it genuinely needs 3 hours. |