Parent info
Parts you need
Affiliate links — we may earn a small commission
Try this circuit in your browser!
Run the code, press the buttons and watch what happens — before you buy any parts. No account needed.
Open in Simulator →Your classmates reported “air pollution exists.” You measured it.
Imagine this: Environmental Science project on air quality. Every group writes a report about how pollution is bad. Your group brings in a device.
You walk from your classroom to the cafeteria to the parking lot to outside — and your device tracks air quality the whole time. You show your teacher: “CO2 equivalent in the cafeteria at lunch: 1,850 ppm. Outside: 410 ppm. That’s 4.5× worse. The ventilation system is failing to exchange air quickly enough.”
That’s not opinion. That’s data.
That’s what we’re building. For about $25.
What you’ll need
| Part | What it does | Price |
|---|---|---|
| ESP32-S3-DevKitC-1 | Brain — reads sensor, runs display, logs data | ~$12 |
| MQ-135 sensor | Detects CO2, ammonia, smoke, VOCs in the air | ~$4 |
| OLED display 0.96” | Shows real-time air quality index | ~$4 |
| Active buzzer | Sounds an alert when air quality drops | ~$2 |
| Breadboard + jumper wires | Connects everything | ~$5 |
| 10kΩ + 20kΩ resistors | Turn the sensor’s 5V signal into a safe 3.3V | ~$1 |
You also need: USB battery bank (to carry it around school), home WiFi for data setup.
Total: ~$25 | Time: ~2 hours | Difficulty: ●●○○○
How it works (60 seconds)
The MQ-135 contains a metal oxide semiconductor that changes electrical resistance when it absorbs different gases. CO2, ammonia, benzene, and other pollutants all affect resistance differently. The ESP32 reads the resistance as a voltage and converts it to an Air Quality Index (AQI).
Think of it as a nose — not perfectly precise, but sensitive enough to tell the difference between fresh outside air (good) and a crowded cafeteria with no ventilation (bad).
The buzzer beeps if the air quality drops below your threshold. The OLED shows a live reading and a mini bar chart.
Step 0: Plan your measurements
Time: ~15 minutes
Before building, design your experiment. Where will you measure? What’s your hypothesis?
Sample hypothesis: “Indoor air quality in crowded spaces will be significantly worse than outdoor air quality during school hours.”
Measurement locations:
| Location | Time | Expected quality |
|---|---|---|
| Outside (baseline) | Any | Good (reference) |
| Empty classroom | Morning | Good |
| Full classroom (30 students) | During class | Moderate |
| Cafeteria at lunch | 12 PM | Poor |
| School hallway between classes | 3 PM | Moderate |
| Gym during PE | Varies | Poor |
Record: Location name, time, raw AQI reading, and any notes (windows open/closed, number of people).
Step 1: Wire it up
Time: ~10 minutes
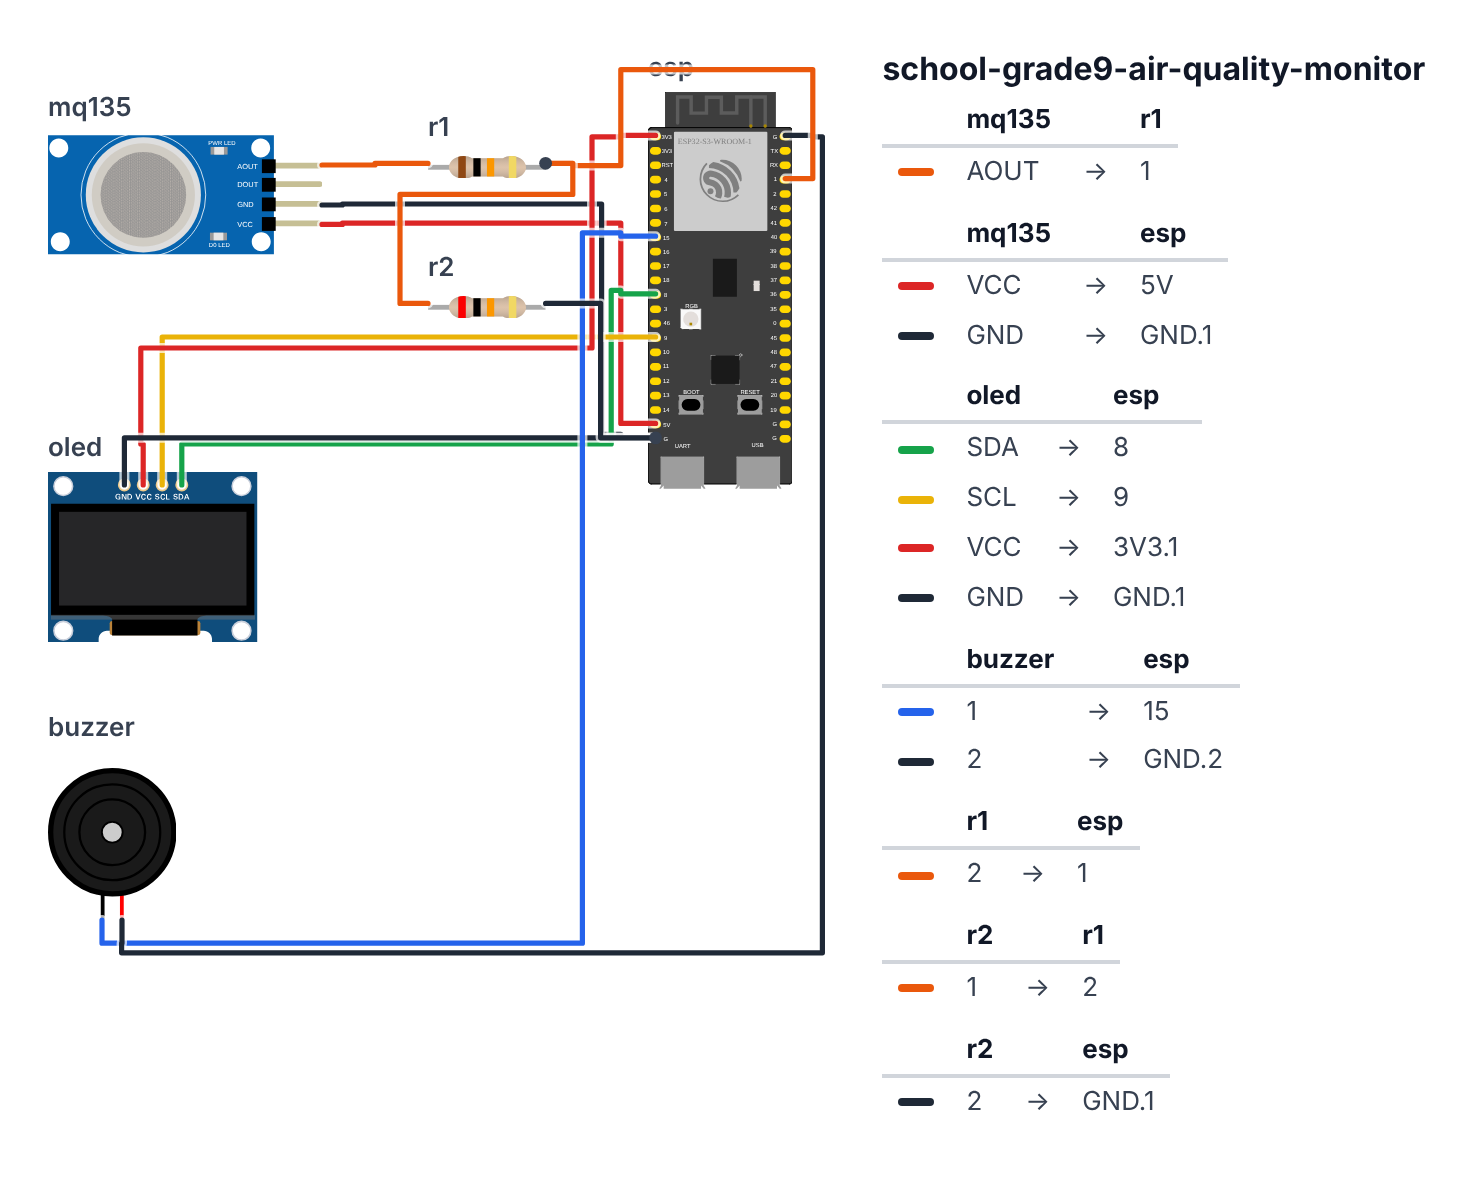
MQ-135 sensor (4 pins on module):
- AOUT (analog signal) → 10kΩ resistor → GPIO 1
- 20kΩ resistor from GPIO 1 → GND — so the 5V sensor signal becomes a safe 3.3V
- DOUT (digital threshold) → not used by this code (leave it unconnected)
- VCC → 5V
- GND → GND
OLED Display: 6. SDA → GPIO 8 (C6: GPIO 6) 7. SCL → GPIO 9 (C6: GPIO 7) 8. VCC → 3.3V 9. GND → GND
Buzzer: 10. Positive (+) → GPIO 15 (C6: GPIO 3) 11. Negative (−) → GND
Check: The MQ-135 needs 5V (not 3.3V) for accurate readings. It has a small heating element inside that warms up over 1–2 minutes. After plugging in, wait 2 minutes before trusting readings.
Important: MQ-135 outputs 0–5V, but ESP32 ADC pins only accept 0–3.3V. That’s why steps 1–2 add a voltage divider: two resistors (10kΩ and 20kΩ) between AOUT and GND, read from the middle (10k + 20k = 2/3 voltage). Don’t skip them.
Step 2: Flash the code
Time: ~15 minutes
Install libraries: Adafruit SSD1306, Adafruit GFX Library
The big picture first. This program turns the ESP32 into a pocket air quality meter:
- The MQ-135 sensor is like a nose — it smells CO2, smoke, and other gases and turns that smell into a voltage.
- The ESP32 reads that voltage, converts it to a single number called an AQI score, and decides whether to sound an alarm.
- The OLED display shows the live AQI number and a tiny bar chart of the last 30 readings.
A program is like a recipe. The computer reads it top to bottom and does exactly what is written, nothing more. Copy this entire recipe into Arduino IDE and upload it:
// ========== CHOOSE YOUR BOARD ==========
// Uncomment the line for YOUR board:
#define BOARD_S3    // ESP32-S3-DevKitC-1
//#define BOARD_C6  // ESP32-C6-DevKitC-1
// ========================================

#ifdef BOARD_S3
  #define PIN_SDA    8
  #define PIN_SCL    9
  #define PIN_SENSOR 1
  #define PIN_BUZZER 15
#endif
#ifdef BOARD_C6
  #define PIN_SDA    6
  #define PIN_SCL    7
  #define PIN_SENSOR 1
  #define PIN_BUZZER 3
#endif

#include <Wire.h>
#include <Adafruit_GFX.h>
#include <Adafruit_SSD1306.h>

#define SCREEN_WIDTH 128
#define SCREEN_HEIGHT 64
#define ALERT_THRESHOLD 600

Adafruit_SSD1306 display(SCREEN_WIDTH, SCREEN_HEIGHT, &Wire, -1);

int readings[30];
int readIdx = 0;
int maxReading = 100;

String getAirQualityLabel(int value) {
  if (value < 200) return "EXCELLENT";
  if (value < 400) return "GOOD";
  if (value < 600) return "MODERATE";
  if (value < 800) return "POOR";
  return "UNHEALTHY";
}

void drawMiniChart() {
  for (int i = 0; i < 30; i++) {
    if (readings[i] == 0) continue;
    int barHeight = map(readings[i], 0, maxReading, 0, 18);
    int x = i * 4;
    display.drawFastVLine(x + 2, 64 - barHeight, barHeight, SSD1306_WHITE);
  }
}

void setup() {
  Serial.begin(115200);
  pinMode(PIN_BUZZER, OUTPUT);
  Wire.begin(PIN_SDA, PIN_SCL);

  if (!display.begin(SSD1306_SWITCHCAPVCC, 0x3C)) {
    Serial.println("OLED error"); while (1);
  }

  display.clearDisplay();
  display.setTextSize(1);
  display.setCursor(10, 28);
  display.println("Sensor warming up...");
  display.println("Please wait 2 min");
  display.display();

  Serial.println("Warming up sensor (120 seconds)...");
  delay(2000);
  Serial.println("Ready!");
}

void loop() {
  long sum = 0;
  for (int i = 0; i < 10; i++) {
    sum += analogRead(PIN_SENSOR);
    delay(10);
  }
  int rawValue = sum / 10;

  int airQuality = map(rawValue, 0, 4095, 0, 1000);

  if (airQuality > maxReading) maxReading = airQuality;

  readings[readIdx % 30] = airQuality;
  readIdx++;

  bool alert = (airQuality > ALERT_THRESHOLD);
  if (alert) {
    digitalWrite(PIN_BUZZER, HIGH);
    delay(100);
    digitalWrite(PIN_BUZZER, LOW);
  }

  display.clearDisplay();

  display.setTextSize(2);
  display.setCursor(0, 0);
  display.println(airQuality);

  display.setTextSize(1);
  display.setCursor(50, 5);
  display.println("AQI");

  display.setCursor(0, 25);
  String label = getAirQualityLabel(airQuality);
  display.println(label);

  if (alert) {
    display.setCursor(90, 25);
    display.println("! ALERT");
  }

  drawMiniChart();

  display.display();

  Serial.println(String(millis()/1000) + "," + String(airQuality) + "," + label);

  delay(1000);
}
Line-by-line: what every line does and why
Lines 1–3: Borrowing ready-made instruction books
#include <Wire.h>
#include <Adafruit_GFX.h>
#include <Adafruit_SSD1306.h>
#include means “grab this instruction book before we start.” Someone already wrote down how to talk to the display, so we don’t have to figure it out ourselves.
- Wire is the book for how parts talk over two shared wires (called I2C).
- Adafruit_GFX is a helper book for drawing text and shapes on any screen.
- Adafruit_SSD1306 is the specific book for our small OLED display.
Lines 5–9: Giving numbers easy names
#define PIN_SENSOR 1
#define PIN_BUZZER 15

#define SCREEN_WIDTH 128
#define SCREEN_HEIGHT 64
#define ALERT_THRESHOLD 600
#define is like writing a nickname on a sticky note. Instead of writing “128” everywhere, we write SCREEN_WIDTH — easier to read and easier to change later. The display is 128 dots wide and 64 dots tall. The air sensor is wired to leg number 1 on the ESP32 (same on the C6). The buzzer is on leg 15 (C6: leg 3). If the air quality score goes above 600, we sound the alarm.
Line 11: Creating the display
Adafruit_SSD1306 display(SCREEN_WIDTH, SCREEN_HEIGHT, &Wire, -1);This creates the display and gives it the name display. It’s like naming a dog so you can call it later. We tell it how big it is (128 × 64 dots), that it talks through Wire (those two shared wires), and -1 means “this display has no reset button.”
Lines 13–15: Boxes for remembering
int readings[30];
int readIdx = 0;
int maxReading = 100;
readings[30] is like a shelf with 30 compartments, one per air reading. int means whole numbers, no decimal. readIdx is a counter for which compartment to fill next — it starts at 0. maxReading keeps track of the highest AQI we have ever seen, which is used to scale the mini chart.
Lines 17–23: A mini recipe that gives words to numbers
String getAirQualityLabel(int value) {
  if (value < 200) return "EXCELLENT";
  if (value < 400) return "GOOD";
  ...
  return "UNHEALTHY";
}
This is a function — a mini recipe with its own name. You hand it one number (value) and it hands back one word. if means “if this is true, do this.” The function checks the number from smallest to largest and stops at the first match. If nothing matches (score is 800 or above), it returns “UNHEALTHY.” Think of it like a traffic light lookup table.
Lines 25–31: Drawing the history chart
void drawMiniChart() {
  for (int i = 0; i < 30; i++) {
    if (readings[i] == 0) continue;
    int barHeight = map(readings[i], 0, maxReading, 0, 18);
    int x = i * 4;
    display.drawFastVLine(x + 2, 64 - barHeight, barHeight, SSD1306_WHITE);
  }
}
void means this mini recipe does something but does not hand back a number. for (int i = 0; i < 30; i++) is a counting loop — it repeats 30 times. Each time, i is one bigger: 0, 1, 2 … 29. if (readings[i] == 0) continue skips empty compartments. map() is like a ruler conversion — it rescales the AQI number (0 to maxReading) to a bar height in pixels (0 to 18). drawFastVLine draws one thin vertical bar. The whole loop draws 30 bars side by side — a tiny history chart.
Lines 33–48: setup() runs once when you power on
void setup() { ... } is the morning routine. It runs only once, when you first plug in the power.
Serial.begin(115200);
pinMode(PIN_BUZZER, OUTPUT);
Wire.begin(PIN_SDA, PIN_SCL);
Serial.begin(115200) opens the phone line to your computer through the USB cable. pinMode(PIN_BUZZER, OUTPUT) tells the ESP32: “Leg 15 (C6: leg 3) is an output — it will send electricity out, not read it in.” Wire.begin(PIN_SDA, PIN_SCL) tells the ESP32 which legs carry the two I2C wires to the display (legs 8 and 9; C6: legs 6 and 7).
if (!display.begin(SSD1306_SWITCHCAPVCC, 0x3C)) {
  Serial.println("OLED error"); while (1);
}
“Display at address 0x3C, are you there?” The 0x3C is the display’s house number on the shared wire — like an apartment number. ! means “NOT.” So: “If the display did NOT respond — print an error and stop forever (while (1)).”
display.println("Sensor warming up...");
display.println("Please wait 2 min");
display.display();
delay(2000);
Show a message while the sensor heats up. display.display() is the most important line — it actually pushes the picture to the screen. Everything before it was drawn in invisible memory. Think of it like printing a document: you can edit all you like, but nothing appears on paper until you press Print.
Lines 50–75: loop() repeats forever
void loop() runs over and over, thousands of times per second.
long sum = 0;
for (int i = 0; i < 10; i++) {
  sum += analogRead(PIN_SENSOR);
  delay(10);
}
int rawValue = sum / 10;
We read the sensor 10 times and average the results. analogRead(PIN_SENSOR) reads a voltage and converts it to a number from 0 to 4095. sum += means “add this to sum.” Dividing by 10 at the end gives the average. Why average? Sensors are noisy — like asking 10 people the temperature and averaging their answers is more accurate than trusting just one.
int airQuality = map(rawValue, 0, 4095, 0, 1000);map() converts the raw sensor number (0–4095) to an air quality score (0–1000). It’s a proportional conversion — like converting Celsius to Fahrenheit, but for sensor values.
if (airQuality > maxReading) maxReading = airQuality;
readings[readIdx % 30] = airQuality;
readIdx++;
Update the highest-ever reading. readIdx % 30 is the remainder trick — after position 29 it wraps back to 0, so the shelf never overflows. readIdx++ adds 1 to the counter.
bool alert = (airQuality > ALERT_THRESHOLD);
if (alert) {
  digitalWrite(PIN_BUZZER, HIGH);
  delay(100);
  digitalWrite(PIN_BUZZER, LOW);
}
bool is a box that holds only “true” or “false” — like a yes/no checkbox. If the air quality score exceeds 600, alert is true. digitalWrite(PIN_BUZZER, HIGH) sends electricity to the buzzer — it beeps. delay(100) waits 100 milliseconds. Then LOW cuts the electricity — it stops.
display.clearDisplay();
display.setTextSize(2);
display.println(airQuality);
display.setTextSize(1);
display.println("AQI");
display.println(label);
drawMiniChart();
display.display();
Clear the screen. Write the big AQI number (size 2 = double size). Write the “AQI” label in small text. Write the quality word (EXCELLENT / GOOD / …). Draw the 30-bar history chart. Then display.display() shows everything at once.
Serial.println(String(millis()/1000) + "," + String(airQuality) + "," + label);
delay(1000);
Print a line to your computer in CSV format: seconds,score,label. You can copy these into a spreadsheet for your report. Then wait 1 second before the next reading.
The whole thing in one sentence
When powered on, the sensor warms up and the display says so (setup). Then forever, every 1 second, it reads the air 10 times, averages the result, converts it to a 0–1000 score, sounds the buzzer if the air is bad, shows the score and a tiny chart on screen, and logs the data to your computer (loop).
First thing to try: After uploading, breathe directly onto the MQ-135 sensor. Your breath has much more CO2 than room air. The AQI number should jump up in a few seconds, then slowly fall back.
Check: After the 2-minute warmup, the reading should stabilize. In fresh outdoor air, you should see lower values. Breathe on the sensor — the number should jump up immediately, then return to baseline within 30 seconds.
Step 3: Calibrate in fresh air
Time: ~10 minutes
Take the device outside. Let it run for 5 minutes. Note the average reading — this is your baseline (100% clean).
Now set your thresholds:
// Add these calibration constants to your code
const int BASELINE = 150;  // Your measured outdoor baseline
const int ALERT_THRESHOLD = BASELINE * 3;  // Alert at 3× outdoor level
This makes your monitor relative to your environment, not some fixed number that may not match your sensor’s exact calibration.
Step 4: Collect your data
Time: 20 minutes during school day
Carry the device (powered by USB battery bank) to each location. At each spot:
- Wait 60 seconds for readings to stabilize
- Record the AQI value and location in a notebook
- Note: how many people, windows open/closed, time of day
Back home, make a bar chart in Google Sheets:
- X axis: locations
- Y axis: AQI reading
- Color bars: green (good) to red (unhealthy)
What you’ll likely find: Classrooms near end of period (CO2 buildup from breathing), cafeteria at lunch (food smells, crowds), gym (activity + sweat), vs. clean outdoor air.
Presentation tip: Open your Serial Monitor log during the presentation. Show the CSV numbers. Then explain: “These aren’t estimated — they’re measured. The cafeteria exceeded WHO indoor air quality guidelines. That’s not a problem in the textbook. That’s a problem in our school.”
What just happened
You used a metal oxide sensor — the MQ series works by heating a tin dioxide layer. Different gases chemisorb onto the surface and change electrical conductivity. The ESP32 reads this as a voltage change on its ADC.
The ADC (Analog-to-Digital Converter) converts continuous voltage (0–3.3V) into a number (0–4095) with 12-bit resolution. That means 4096 discrete steps over the full voltage range — each step is about 0.8 millivolts.
Curriculum connections:
- NGSS ESS3-3: Apply scientific principles to design a method for monitoring and minimizing a human impact on the environment
- NGSS HS-ESS3-4: Evaluate or refine a technological solution that reduces impacts of human activities on natural systems
- Common Core ELA RST.9-10.3: Follow precisely a complex multistep procedure when carrying out experiments
Real environmental monitoring stations use more precise sensors (NDIR for CO2, photoionization for VOCs) but the same principle: measure a physical property of air and convert it to a number that correlates with pollution.
Level Up
Multiple pollutants: Add an MQ-7 sensor (CO-specific, $3) and an MQ-2 (smoke/gas, $3). Build a multi-sensor air quality station.
Data logger: Add a microSD card module ($2) to save all readings with timestamps. Log a full school day. Graph the data over 8 hours.
GPS tagging: Add a GPS module ($10) to automatically record coordinates. Map your measurements on Google Maps.
Troubleshooting
| Problem | Fix |
|---|---|
| Readings are always max (4095) | Voltage divider issue — 5V from sensor going into 3.3V ADC. Add the voltage divider (10kΩ + 20kΩ) |
| No reading change at all | Make sure sensor is warmed up (2 min). Try breathing directly on it. |
| OLED not showing | Check SDA=GPIO 8, SCL=GPIO 9 (C6: GPIO 6 and GPIO 7), VCC=3.3V |
| Buzzer won’t stop | Lower ALERT_THRESHOLD in code, or check your baseline calibration |
| Upload fails | Hold BOOT button while clicking Upload |