Parent info
Parts you need
Affiliate links — we may earn a small commission
Try this circuit in your browser!
Run the code, press the buttons and watch what happens — before you buy any parts. No account needed.
Open in Simulator →Your classmates researched earthquakes online. You built a seismograph.
Grade 8 earth science: earthquakes and tectonic plates. Everyone researches online, prints out the Richter scale, describes P-waves and S-waves on a poster. Nobody has actually seen a seismograph reading from something they built.
Your device uses an MPU6050 accelerometer — the same type of chip in every smartphone — to detect ground vibrations and draw a live seismograph trace on an OLED display. Tap the table: you see a spike. Truck drives by outside: you see a small wave. Slam a door: dramatic spike. That rolling wave on the screen is exactly what geologists look at when they monitor earthquakes. Except theirs cost $10,000.
Yours cost $22.
What you’ll need
| Part | What it does | Price |
|---|---|---|
| ESP32-S3-DevKitC-1 | The brain — samples the accelerometer at high speed | ~$12 |
| MPU6050 module | 3-axis accelerometer + gyroscope in one chip | ~$5 |
| 0.96” OLED display | Shows the live seismograph trace | ~$5 |
| Breadboard + jumper wires | Connects everything | ~$5 |
Total: ~$27 | Time: ~2 hours | Difficulty: ●●●○○
What is the MPU6050? It’s an Inertial Measurement Unit (IMU) — a chip that measures acceleration in three axes (X, Y, Z) and rotation in three axes simultaneously. The chip in your phone uses the same technology to detect orientation, steps, and shaking. The MPU6050 samples at up to 1000 readings per second, which is fast enough to detect the short vibration pulses from ground shaking.
How it works (60 seconds)
The MPU6050 measures acceleration every 10 milliseconds. When the table is still, it reads close to 0 on all axes (plus gravity). When you tap the table, the Z-axis spikes suddenly. The ESP32 reads this spike, stores it in a 128-value buffer (matching the screen width), and draws it as a waveform on the OLED — just like a real seismograph trace scrolling from right to left. Bigger vibrations = taller spikes. You can quantify “how strong was that tap?” by looking at the peak amplitude.
Step 0: Understand the signals first
Time: ~5 minutes
A seismograph doesn’t measure distance — it measures acceleration (change in velocity). When the ground shakes, it accelerates. The sensor measures that acceleration in units of g (gravitational acceleration = 9.8 m/s²).
Real seismograph scale:
- Quiet office floor: < 0.001g variation
- Human footstep nearby: ~0.01-0.05g
- Knocking on the table: ~0.1-1.0g
- An actual earthquake at 100km distance: depends on magnitude, but even a 3.0 earthquake produces measurable vibrations
Your sensor will detect the knocking-on-table scale, not actual earthquakes (unless you live very close to a fault line). But the principle — and the waveform shape — is identical.
Step 1: Wire it up
Time: ~10 minutes
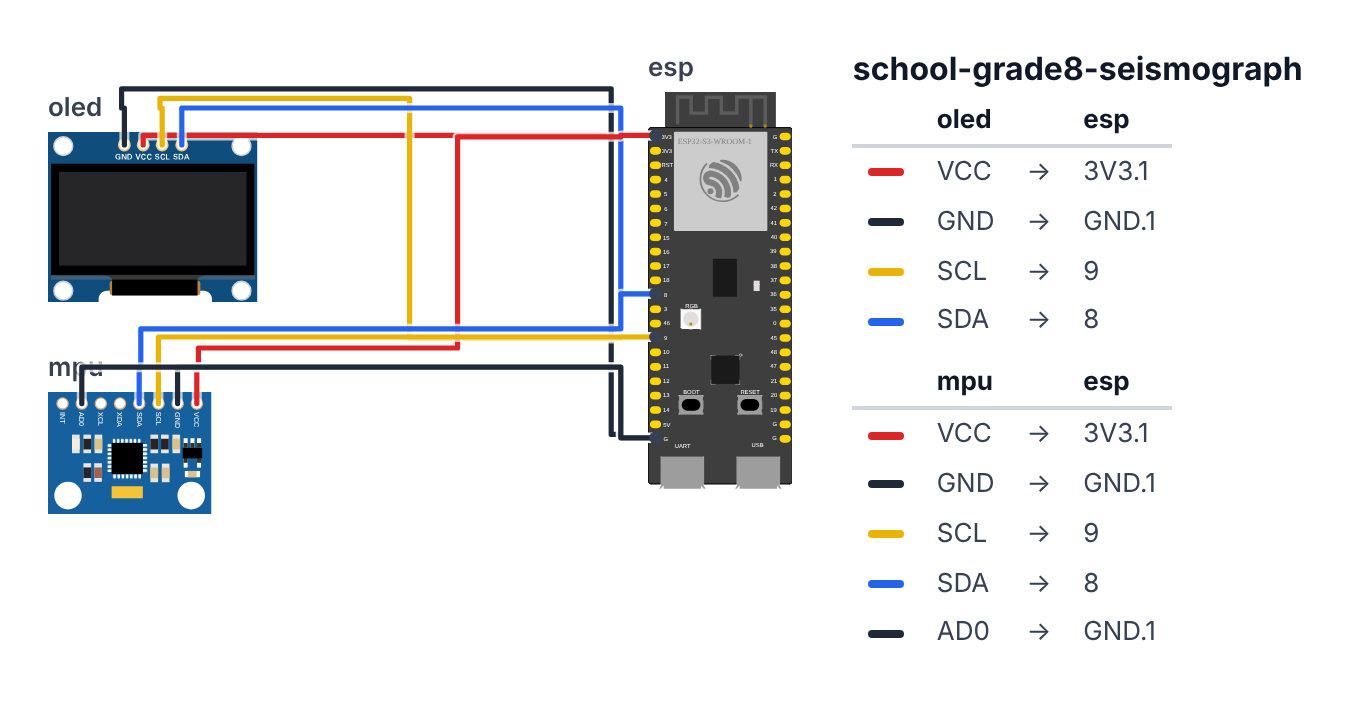
Both the MPU6050 and OLED use I2C, so they share the same two data wires:
OLED Display:
- OLED VCC → board 3.3V — red wire
- OLED GND → board GND — black wire
- OLED SCL → board GPIO 9 (C6: GPIO 7) — yellow wire
- OLED SDA → board GPIO 8 (C6: GPIO 6) — blue wire
MPU6050 (shares I2C bus): 5. MPU6050 VCC → board 3.3V — red wire 6. MPU6050 GND → board GND — black wire 7. MPU6050 SCL → board GPIO 9 (C6: GPIO 7) — yellow wire 8. MPU6050 SDA → board GPIO 8 (C6: GPIO 6) — blue wire 9. MPU6050 AD0 → board GND — black wire (sets I2C address to 0x68)
Check: The MPU6050 I2C address is 0x68 when AD0 is pulled LOW (to GND), or 0x69 when AD0 is pulled HIGH. We use 0x68. If you connect two MPU6050s, set one to 0x69 by pulling its AD0 to 3.3V.
Step 2: Flash the code
Time: ~20 minutes
Install the MPU6050 library by Electronic Cats, and Adafruit SSD1306 + Adafruit GFX libraries.
Think of this code as a pen that draws on paper that never stops moving — except the “pen” is a math number and the “paper” is the OLED screen. Every 10 milliseconds the chip reads three numbers from the accelerometer (how hard it is being pushed left-right, front-back, up-down), combines them into one “total shake” number, and writes it into a list of 128 values. The OLED screen is also 128 pixels wide, so one pixel per reading — the screen shows exactly the last 1.28 seconds of vibration history. When the list fills up, new readings overwrite the oldest ones, like a clock that resets at midnight. Before any of this starts, the code spends 1 second collecting 100 “quiet” readings to establish what “no vibration” looks like — everything measured after that is compared against this personal zero.
// ========== CHOOSE YOUR BOARD ==========
// Uncomment the line for YOUR board:
#define BOARD_S3    // ESP32-S3-DevKitC-1
//#define BOARD_C6  // ESP32-C6-DevKitC-1
// ========================================

#ifdef BOARD_S3
  #define PIN_SDA   8
  #define PIN_SCL   9
#endif
#ifdef BOARD_C6
  #define PIN_SDA   6
  #define PIN_SCL   7
#endif

#include <Wire.h>
#include <MPU6050.h>
#include <Adafruit_SSD1306.h>

#define SCREEN_WIDTH 128
#define SCREEN_HEIGHT 64
Adafruit_SSD1306 display(SCREEN_WIDTH, SCREEN_HEIGHT, &Wire, -1);

MPU6050 mpu;

#define TRACE_WIDTH 128
float traceBuffer[TRACE_WIDTH];
int traceIndex = 0;

float baselineZ = 0;
float baselineAccum = 0;
int baselineSamples = 0;
bool calibrated = false;

float peakValue = 0;
unsigned long lastPeak = 0;

float sensitivity = 500.0;

float calculateMagnitude(int16_t ax, int16_t ay, int16_t az) {
  float gx = ax / 16384.0;
  float gy = ay / 16384.0;
  float gz = az / 16384.0;

  gz -= 1.0;

  return sqrt(gx*gx + gy*gy + gz*gz);
}

void drawSeismograph() {
  display.clearDisplay();
  display.setTextColor(SSD1306_WHITE);

  display.setTextSize(1);
  display.setCursor(0, 0);
  display.print("SEISMOGRAPH");

  display.setCursor(72, 0);
  display.print("P:");
  display.print(peakValue * 1000, 0);
  display.println("mg");

  display.drawLine(0, 9, 128, 9, SSD1306_WHITE);

  int centerY = 36;
  display.drawLine(0, centerY, TRACE_WIDTH - 1, centerY, SSD1306_WHITE);

  for (int i = 0; i < TRACE_WIDTH - 1; i++) {
    int idx = (traceIndex + i) % TRACE_WIDTH;
    int nextIdx = (traceIndex + i + 1) % TRACE_WIDTH;

    int y1 = centerY - (int)(traceBuffer[idx] * sensitivity);
    int y2 = centerY - (int)(traceBuffer[nextIdx] * sensitivity);

    y1 = constrain(y1, 10, 63);
    y2 = constrain(y2, 10, 63);

    display.drawLine(i, y1, i + 1, y2, SSD1306_WHITE);
  }

  if (!calibrated) {
    display.setCursor(0, 56);
    display.print("Calibrating... ");
    display.print(baselineSamples);
    display.print("/100");
  }

  display.display();
}

void setup() {
  Serial.begin(115200);
  Wire.begin(PIN_SDA, PIN_SCL);

  if (!display.begin(SSD1306_SWITCHCAPVCC, 0x3C)) {
    while (true);
  }

  display.clearDisplay();
  display.setTextColor(SSD1306_WHITE);
  display.setCursor(0, 0);
  display.println("SEISMOGRAPH");
  display.println("Initializing MPU6050");
  display.display();

  mpu.initialize();

  if (!mpu.testConnection()) {
    display.clearDisplay();
    display.setCursor(0, 0);
    display.println("MPU6050 not found!");
    display.println("Check wiring.");
    display.println("AD0 -> GND");
    display.display();
    while (true);
  }

  mpu.setFullScaleAccelRange(MPU6050_ACCEL_FS_2);
  mpu.setDLPFMode(MPU6050_DLPF_BW_10);

  for (int i = 0; i < TRACE_WIDTH; i++) traceBuffer[i] = 0;

  display.clearDisplay();
  display.setCursor(0, 0);
  display.println("Keep sensor STILL");
  display.println("for 5 seconds...");
  display.display();
}

unsigned long lastSample = 0;
unsigned long displayUpdate = 0;

void loop() {
  unsigned long now = millis();

  if (now - lastSample >= 10) {
    int16_t ax, ay, az, gx, gy, gz;
    mpu.getMotion6(&ax, &ay, &az, &gx, &gy, &gz);

    float magnitude = calculateMagnitude(ax, ay, az);

    if (!calibrated) {
      baselineAccum += magnitude;
      baselineSamples++;

      if (baselineSamples >= 100) {
        baselineZ = baselineAccum / baselineSamples;
        calibrated = true;
      }
    } else {
      float vibration = magnitude - baselineZ;
      if (vibration < 0) vibration = -vibration;

      traceBuffer[traceIndex] = vibration;
      traceIndex = (traceIndex + 1) % TRACE_WIDTH;

      if (vibration > peakValue) {
        peakValue = vibration;
        lastPeak = now;
      }

      if (now - lastPeak > 5000) {
        peakValue = peakValue * 0.95;
      }

      static int logCount = 0;
      logCount++;
      if (logCount % 10 == 0) {
        Serial.print(now); Serial.print(",");
        Serial.print(vibration * 1000, 2);
        Serial.print(",");
        if (vibration < 0.002) Serial.println("quiet");
        else if (vibration < 0.010) Serial.println("low");
        else if (vibration < 0.050) Serial.println("medium");
        else Serial.println("HIGH");
      }
    }

    lastSample = now;
  }

  if (now - displayUpdate >= 50) {
    drawSeismograph();
    displayUpdate = now;
  }
}
Line-by-line: what every line does and why
Libraries and sensor objects
#include <MPU6050.h> — loads the toolkit for talking to the MPU6050 chip. Without it, you would need to read a 50-page datasheet and send raw binary commands over I2C by hand.
MPU6050 mpu; — creates one MPU6050 object called mpu. Think of it as making a “remote control” for the chip. All commands like mpu.initialize() and mpu.getMotion6() go through this object.
The circular trace buffer
#define TRACE_WIDTH 128 — the seismograph trace is 128 values wide, one per pixel across the OLED.
float traceBuffer[TRACE_WIDTH]; — an array (shelf) of 128 floating-point numbers. Each slot holds one vibration reading. float means decimal numbers (like 0.003 g), not just whole numbers.
int traceIndex = 0; — points to the current write position in the buffer. It counts up from 0 to 127, then wraps back to 0. This is the circular buffer idea: like a clock that resets at midnight. Old readings are overwritten, newest readings always appear at the “right edge” of the screen.
Calibration variables
float baselineAccum = 0; — accumulates (adds up) 100 readings during calibration. float baselineZ = 0; — will store the average of those 100 readings.
bool calibrated = false; — a flag that starts as false. Once 100 samples are collected, it becomes true and the seismograph switches from “learning quiet” mode to “detecting vibration” mode.
Sensitivity
float sensitivity = 500.0; — a scale factor. Each vibration reading is multiplied by this before drawing on screen. 0.003 g × 500 = 1.5 pixels above the center line. If vibrations look too small, increase to 2000. If everything clips at the top, decrease to 200.
calculateMagnitude() — combining three axes into one number
float gx = ax / 16384.0;
float gy = ay / 16384.0;
float gz = az / 16384.0;
gz -= 1.0;
return sqrt(gx*gx + gy*gy + gz*gz);
The MPU6050 returns raw integers. ax / 16384.0 converts to “g units” (where 1g = Earth’s gravity). The 16384 comes from the chip’s spec sheet: at the ±2g sensitivity setting, 16384 raw = exactly 1.0 g.
gz -= 1.0 — when the sensor sits flat on a table, gravity pulls straight down, so the Z axis reads 1g constantly. Subtracting 1.0 removes gravity so only real vibrations remain.
sqrt(gx*gx + gy*gy + gz*gz) — this is the 3D version of the Pythagorean theorem (the formula for the length of a triangle’s hypotenuse: a² + b² = c²). In 3D it becomes: total force = √(x² + y² + z²). This gives one number representing total vibration intensity regardless of direction.
drawSeismograph() — drawing the scrolling trace
display.print(peakValue * 1000, 0) — multiplies by 1000 to convert g to milli-g (thousandths of a g). peakValue = 0.015 g becomes “15 mg” on screen. The , 0 means no decimal places.
int centerY = 36; — the horizontal center line sits at pixel row 36 (out of rows 10–63, which is a 54-pixel graph area). Vibrations draw above the center line (smaller Y number = higher on screen).
The for (int i = 0; i < TRACE_WIDTH - 1; i++) loop draws 127 line segments connecting 128 data points (like connect-the-dots across the full screen width).
int idx = (traceIndex + i) % TRACE_WIDTH; — this is how the circular buffer is read. traceIndex marks the oldest data. Adding i steps forward through the buffer. The % (modulo) wraps around when i goes past 127. This ensures the oldest data appears at the left, the newest at the right — the classic scrolling seismograph look.
y1 = centerY - (int)(traceBuffer[idx] * sensitivity); — converts a vibration value to a pixel position. The minus sign means “bigger vibration = higher on screen.” constrain(y1, 10, 63) clips values that would go above the title bar or below the screen edge.
setup() — chip configuration
mpu.initialize() — sends the “wake up and start measuring” command to the MPU6050. The chip starts in sleep mode by default to save power.
mpu.testConnection() — asks the chip “are you there?” and returns true or false. If it returns false (wiring problem), the screen shows an error and while (true) halts the program so you can diagnose the issue.
mpu.setFullScaleAccelRange(MPU6050_ACCEL_FS_2) — sets the accelerometer to its most sensitive mode: ±2g range. “Full scale ±2g” means it can measure accelerations from -2g to +2g. For table taps and footsteps (well under 1g), this is ideal. Higher ranges (±4g, ±8g) cover stronger shakes but are less sensitive to small ones.
mpu.setDLPFMode(MPU6050_DLPF_BW_10) — turns on a digital low-pass filter at 10 Hz bandwidth. High-frequency electrical noise (fast random jitter from the chip’s electronics) is filtered out. Real seismic events (like table taps) happen at lower frequencies and pass through. “Low-pass” means “only let slow changes through.”
for (int i = 0; i < TRACE_WIDTH; i++) traceBuffer[i] = 0; — fills all 128 buffer slots with 0 before anything starts. Without this, the buffer contains random garbage from RAM that would show up as fake spikes.
loop() — the sampling and display cycle
if (now - lastSample >= 10) — runs every 10 milliseconds = 100 times per second (100 Hz). This is the sampling rate. Real seismographs sample at 100–200 Hz, so this matches professional equipment.
int16_t ax, ay, az, gx, gy, gz; — declares six 16-bit integers to receive the raw sensor data. int16_t means “a whole number that fits in 16 bits” (-32,768 to +32,767). The chip outputs raw numbers in this range.
mpu.getMotion6(&ax, &ay, &az, &gx, &gy, &gz) — asks the chip for all six readings at once (acceleration X/Y/Z and rotation X/Y/Z). The & before each variable name means “write the result directly into this variable’s memory location” — a technique called passing by reference.
Calibration phase (first 100 samples):
baselineAccum += magnitude; — adds each new reading to a running total. baselineSamples++ counts how many samples were collected. After 100 samples: baselineZ = baselineAccum / baselineSamples divides the total by the count to get the average. This average is the “quiet floor” — the vibration level when nothing is happening.
After calibration:
float vibration = magnitude - baselineZ; — subtracts the quiet floor so real vibrations stand out above zero.
if (vibration < 0) vibration = -vibration; — takes the absolute value. If magnitude briefly dips below baselineZ (normal measurement noise), the result would be negative. Negative vibrations make no physical sense for a magnitude, so we flip the sign.
traceBuffer[traceIndex] = vibration; — stores the reading in the circular buffer.
traceIndex = (traceIndex + 1) % TRACE_WIDTH; — advances the write position. When traceIndex reaches 127, (127 + 1) % 128 = 0, so it wraps back to the start.
Peak tracking:
if (vibration > peakValue) { peakValue = vibration; lastPeak = now; } — if this reading is the biggest seen so far, update the record.
if (now - lastPeak > 5000) { peakValue = peakValue * 0.95; } — after 5 seconds with no new peak, the peak value slowly shrinks (× 0.95 per 10ms = fades over time). This stops old peaks from “sticking” on the display forever.
Serial logging:
static int logCount = 0; — static means this variable remembers its value between calls (it is not reset to 0 every 10ms). logCount % 10 == 0 logs every 10th sample, which is once per second at 100 Hz sampling. The CSV output (time, milli-g, category) can be pasted into a spreadsheet.
Display update:
if (now - displayUpdate >= 50) — refreshes the OLED 20 times per second (every 50ms). Drawing faster than 20Hz would waste time without visible benefit since eyes can only see ~24 frames per second.
The whole thing in one sentence: Every 10 milliseconds the chip measures 3D acceleration, combines it into one vibration number, stores it in a 128-slot circular buffer, and scrolls it across the OLED as a live seismograph trace — with a 1-second calibration phase at the start to establish the personal “quiet” baseline.
First thing to try: After uploading, keep the sensor completely still for 5 seconds (you will see “Calibrating… X/100” counting up). Then tap the table once hard — you should see a clear spike shoot up on the OLED trace.
Check: After uploading, wait 5 seconds for calibration (keep the sensor still). Then tap the table — you should see a spike in the trace. The waveform scrolls from right to left, just like a real seismograph. The “P:” value shows the peak vibration in milli-g (thousandths of a gravitational unit).
Step 3: Conduct your seismic experiments
Measure different “seismic events”:
- Baseline — let it sit still for 30 seconds. What’s the noise floor? (Should be near 0)
- Tap the table lightly — record the peak value
- Slam a door in another room — can you detect it?
- Footsteps — have someone walk across the room. Can you detect their steps?
- Truck passing — if you’re near a road, watch for vehicles
Log these peak values in your data table. Compare them on a scale. This is how seismologists calibrate: they know what 0.01g feels like, so when they measure 0.0001g, they can extrapolate to what a real earthquake 500km away would look like.
What just happened
Concepts you used:
- Accelerometers — measure rate of change of velocity (acceleration). Used in phones, cars, game controllers, spacecraft.
- Noise floor — even when nothing is happening, sensors produce small random variations (noise). Your baseline calibration step measured this. Everything above the noise floor is a real signal.
- Signal scrolling (circular buffer) — the trace scrolls by moving an index through a fixed-size array. No data is actually “moved” — just the pointer. This is efficient and fast.
- Earthquake waves (P and S) — real earthquakes produce two kinds of waves: P-waves (compression, arrive first, show as rapid oscillations) and S-waves (shear, arrive later, larger amplitude). On a real seismograph, you see the P-wave arrival, then the S-wave arrival. Your device would show both if you could get close enough to a real quake.
Curriculum alignment: NGSS MS-ESS2-2 (Construct an explanation based on evidence for how geoscience processes have changed Earth’s surface at varying time and spatial scales). Also MS-ESS3-2 (Analyze and interpret data on natural hazards to forecast future catastrophic events).
Presentation tip: Set up your seismograph on the presenter’s table. At the start of your presentation, tap the table once. The class will see the spike on the OLED. Then say: “That tap registered [X] milli-g. A 4.0 earthquake 50km away would register about 5 milli-g on a seismograph. We’re in the same order of magnitude — that’s how sensitive these instruments are.” Connect your data to real earthquake scales.
Level Up
Richter-scale approximation: The Richter scale is logarithmic. Research the formula and add code that estimates a rough “local magnitude” from your acceleration readings.
Multi-axis display: Show separate traces for X, Y, and Z axes on the same display. Different events create different axis signatures — a table knock is mostly Z, footsteps have X and Y components too.
Event logger: When vibration exceeds a threshold, log the event to Serial with a timestamp. Review your log at the end of the day — what events were recorded?
★★ You completed: Grade 8 Seismograph!
Troubleshooting
| Problem | Fix |
|---|---|
| MPU6050 not found | Check AD0 connected to GND (not floating). Check SCL/SDA on GPIO 9/8 (C6: GPIO 7/6). |
| Trace is always flat | Sensitivity too low. Increase sensitivity from 500 to 2000. Or check baseline calibration happened (keep still for 5 seconds). |
| Trace is always saturated (all spikes) | Sensitivity too high or baseline calibration failed. Press RESET and keep sensor still during 5-second calibration. |
| Random spikes with no vibration | Increase the DLPF filter: change MPU6050_DLPF_BW_10 to MPU6050_DLPF_BW_5 for more aggressive noise filtering. |
| Display flickers | Reduce display update rate: change 50 in now - displayUpdate >= 50 to 100. |