Parent info
Parts you need
Affiliate links — we may earn a small commission
Try this circuit in your browser!
Run the code, press the buttons and watch what happens — before you buy any parts. No account needed.
Open in Simulator →Your classmates drew supply and demand curves. Yours is interactive.
Imagine this: Economics class, supply and demand unit. Everyone draws a graph. You label the equilibrium point. The teacher nods. Done.
Your project is a physical price simulator. Four buttons: “Demand Up,” “Demand Down,” “Supply Up,” “Supply Down.” A 10-LED bargraph shows the current price level. When demand goes up, the price bar rises. When supply increases, it falls. When you cause a shortage, the bar maxes out and a buzzer sounds.
Your classmates understand the theory. You built a model that lets anyone experience it.
That’s what we’re building. For about $20.
What you’ll need
| Part | What it does | Price |
|---|---|---|
| ESP32-S3-DevKitC-1 | Brain — runs the economics simulation | ~$12 |
| LED bar graph (10-segment) | Visual price indicator — more LEDs = higher price | ~$3 |
| Push buttons ×4 | Control supply and demand changes | ~$3 |
| Breadboard + jumper wires | Wires everything | ~$5 |
You also need: 10× resistors (220Ω, for the LED bargraph).
Total: ~$20 | Time: ~1–2 hours | Difficulty: ●●○○○
How it works (60 seconds)
The simulation tracks two variables: Supply (1–10) and Demand (1–10).
Price equilibrium = Demand ÷ Supply × 5 (scaled to 1–10 range).
When demand > supply: prices rise (shortage). When supply > demand: prices fall (surplus). When equal: stable equilibrium.
The LED bargraph shows the current price — each LED represents one price unit. The OLED shows exact numbers. The buttons adjust supply and demand, and you watch equilibrium recalculate in real time.
Step 0: Understand the economics model
The basic supply-demand model:
- Equilibrium price: Where quantity supplied = quantity demanded
- Demand shift up: Consumers want more → price rises
- Supply shift up: Producers offer more → price falls
- Shortage: Demand > Supply → price pressure up
- Surplus: Supply > Demand → price pressure down
Your simulation scenarios:
| Scenario | What happens | What to do |
|---|---|---|
| New product hype | Demand spikes | Press Demand Up ×3 |
| Factory opens | Supply increases | Press Supply Up ×3 |
| Natural disaster | Supply drops | Press Supply Down ×2 |
| Recession | Demand falls | Press Demand Down ×3 |
| Monopoly | Fix supply low | Hold Supply Down |
Step 1: Wire it up
Time: ~20 minutes
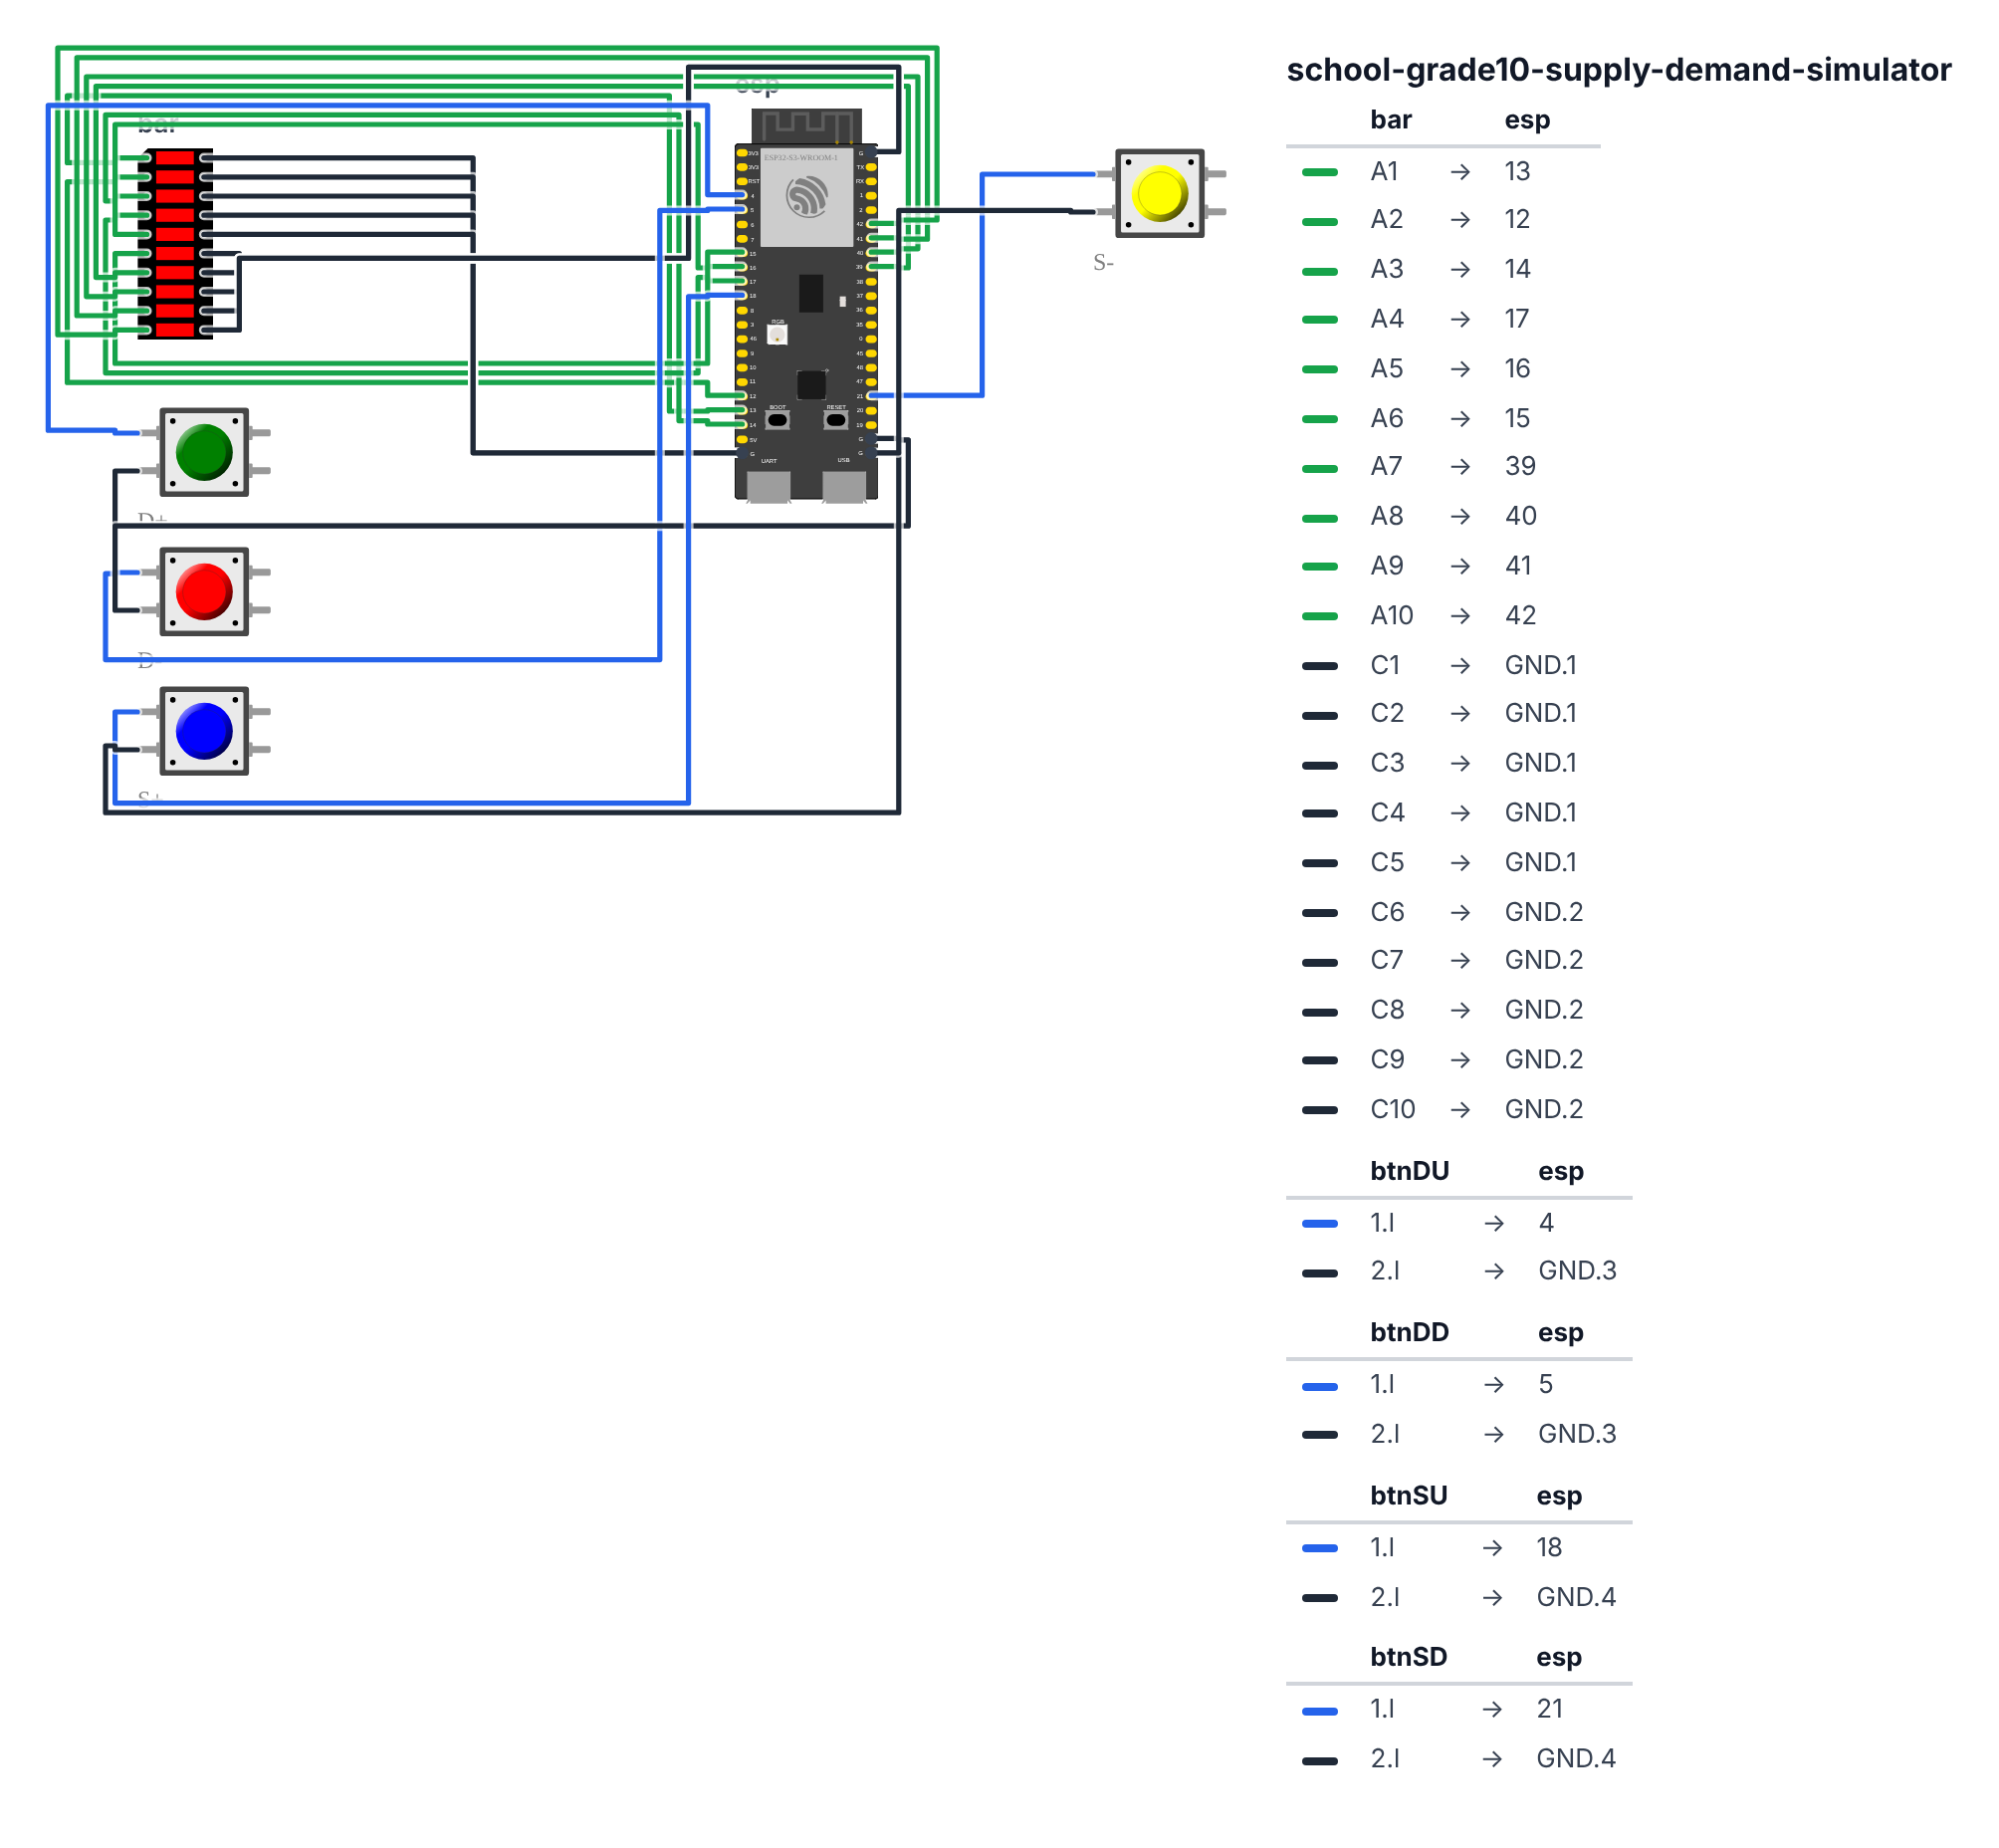
LED bargraph (10 LEDs, needs 10 GPIO pins + 220Ω resistors each):
Connect each LED segment through a 220Ω resistor to a GPIO pin:
| LED # | ESP32-S3 | ESP32-C6 |
|---|---|---|
| LED 1 (bottom) | GPIO 13 | GPIO 18 |
| LED 2 | GPIO 12 | GPIO 20 |
| LED 3 | GPIO 14 | GPIO 21 |
| LED 4 | GPIO 17 | GPIO 22 |
| LED 5 | GPIO 16 | GPIO 23 |
| LED 6 | GPIO 15 | GPIO 15 |
| LED 7 | GPIO 39 | GPIO 5 |
| LED 8 | GPIO 40 | GPIO 4 |
| LED 9 | GPIO 41 | GPIO 3 |
| LED 10 (top) | GPIO 42 | GPIO 10 |
All LED cathodes (negative legs) → GND.
Good to know: The wiring picture leaves out the ten 220Ω resistors to keep it readable. You still need one resistor between each GPIO pin and its LED.
4 buttons:
- Button D+ → board GPIO 4 (C6: GPIO 0) (Demand Up)
- Button D− → board GPIO 5 (C6: GPIO 9) (Demand Down)
- Button S+ → board GPIO 18 (C6: GPIO 11) (Supply Up)
- Button S− → board GPIO 21 (C6: GPIO 19) (Supply Down)
One side of each button → GPIO, other side → GND. Use INPUT_PULLUP.
Check: 10 LEDs + 4 buttons = 14 GPIO connections. Make sure each LED has its own 220Ω resistor between the GPIO and the LED anode.
Step 2: Flash the code
Time: ~15 minutes
The big picture first. This program is a physical economic simulation:
- Two variables (
demandLevelandsupplyLevel) each go from 1 to 10. Four buttons change them. - The program calculates the equilibrium price using a simple formula: price = demand ÷ supply × 5.
- Instead of jumping instantly to the new price, it moves 30% closer every 500 ms — simulating the market adjustment lag that real economists observe.
- A 10-LED bargraph shows the current price level: more LEDs lit = higher price.
A program is like a recipe. The computer reads it top to bottom and does exactly what is written, nothing more. Copy this entire recipe into Arduino IDE and upload it:
// ========== CHOOSE YOUR BOARD ==========
// Uncomment the line for YOUR board:
#define BOARD_S3    // ESP32-S3-DevKitC-1
//#define BOARD_C6  // ESP32-C6-DevKitC-1
// ========================================

#ifdef BOARD_S3
  const int LED_PINS[10] = {13, 12, 14, 17, 16, 15, 39, 40, 41, 42};
  const int BTN_D_UP   = 4;
  const int BTN_D_DOWN = 5;
  const int BTN_S_UP   = 18;
  const int BTN_S_DOWN = 21;
#endif
#ifdef BOARD_C6
  const int LED_PINS[10] = {18, 20, 21, 22, 23, 15, 5, 4, 3, 10};
  const int BTN_D_UP   = 0;
  const int BTN_D_DOWN = 9;
  const int BTN_S_UP   = 11;
  const int BTN_S_DOWN = 19;
#endif

#include <WiFi.h>
#include <WebServer.h>

float demandLevel = 5.0;
float supplyLevel = 5.0;
float price = 5.0;
float targetPrice = 5.0;
String marketStatus = "Equilibrium";

float priceHistory[50];
int historyIdx = 0;

float calculateEquilibrium() {
  return constrain((demandLevel / supplyLevel) * 5.0, 1.0, 10.0);
}

void updateDisplay(int priceLevel) {
  for (int i = 0; i < 10; i++) {
    if (i < priceLevel) {
      digitalWrite(LED_PINS[i], HIGH);
    } else {
      digitalWrite(LED_PINS[i], LOW);
    }
  }
}

void setup() {
  Serial.begin(115200);

  for (int i = 0; i < 10; i++) {
    pinMode(LED_PINS[i], OUTPUT);
    digitalWrite(LED_PINS[i], LOW);
  }

  pinMode(BTN_D_UP, INPUT_PULLUP);
  pinMode(BTN_D_DOWN, INPUT_PULLUP);
  pinMode(BTN_S_UP, INPUT_PULLUP);
  pinMode(BTN_S_DOWN, INPUT_PULLUP);

  for (int i = 0; i < 10; i++) {
    digitalWrite(LED_PINS[i], HIGH);
    delay(100);
  }
  for (int i = 9; i >= 0; i--) {
    digitalWrite(LED_PINS[i], LOW);
    delay(100);
  }

  Serial.println("Supply/Demand Simulator Ready");
  Serial.println("Supply: 5 | Demand: 5 | Price: 5");

  updateDisplay(5);
}

unsigned long lastButton = 0;
unsigned long lastPriceUpdate = 0;

void loop() {
  if (millis() - lastButton > 300) {
    bool changed = false;

    if (digitalRead(BTN_D_UP) == LOW) {
      demandLevel = min(demandLevel + 0.5, 10.0);
      changed = true;
    }
    if (digitalRead(BTN_D_DOWN) == LOW) {
      demandLevel = max(demandLevel - 0.5, 1.0);
      changed = true;
    }
    if (digitalRead(BTN_S_UP) == LOW) {
      supplyLevel = min(supplyLevel + 0.5, 10.0);
      changed = true;
    }
    if (digitalRead(BTN_S_DOWN) == LOW) {
      supplyLevel = max(supplyLevel - 0.5, 1.0);
      changed = true;
    }

    if (changed) {
      lastButton = millis();
      targetPrice = calculateEquilibrium();

      float ratio = demandLevel / supplyLevel;
      if (ratio > 1.5) marketStatus = "SHORTAGE";
      else if (ratio < 0.67) marketStatus = "SURPLUS";
      else marketStatus = "Equilibrium";

      Serial.printf("Supply:%.1f Demand:%.1f Target:%.1f [%s]\n",
                    supplyLevel, demandLevel, targetPrice, marketStatus.c_str());
    }
  }

  if (millis() - lastPriceUpdate > 500) {
    lastPriceUpdate = millis();

    if (abs(price - targetPrice) > 0.1) {
      price += (targetPrice - price) * 0.3;
    }

    int displayLevel = constrain((int)round(price), 1, 10);
    updateDisplay(displayLevel);

    priceHistory[historyIdx % 50] = price;
    historyIdx++;
  }
}
Line-by-line: what every line does and why
Lines 3–4: The LED bargraph pin array
const int LED_PINS[10] = {13, 12, 14, 17, 16, 15, 39, 40, 41, 42};const int means these numbers never change. LED_PINS[10] is an array of 10 leg numbers — one per LED segment. LED #0 (bottom, lowest price) is on leg 13 (C6: leg 18); LED #9 (top, highest price) is on leg 42 (C6: leg 10). By storing them in an array, the for loop in updateDisplay() can light them all with a single line of code instead of writing 10 separate lines.
Lines 6–9: Button pin names
const int BTN_D_UP   = 4;
const int BTN_D_DOWN = 5;
const int BTN_S_UP   = 18;
const int BTN_S_DOWN = 21;
Four sticky-note names for the four button legs. D = Demand, S = Supply, UP/DOWN = direction.
Lines 11–17: The economic state
float demandLevel = 5.0;
float supplyLevel = 5.0;
float price = 5.0;
float targetPrice = 5.0;
String marketStatus = "Equilibrium";
float means numbers with decimal points. Both demand and supply start at 5 (the midpoint of 1–10). price is what the bargraph currently shows. targetPrice is where the price is heading — they are different because the price moves gradually. String is a text box — it holds one of three labels: “SHORTAGE”, “SURPLUS”, or “Equilibrium”.
Lines 21–23: calculateEquilibrium() — the economic formula
float calculateEquilibrium() {
  return constrain((demandLevel / supplyLevel) * 5.0, 1.0, 10.0);
}
demandLevel / supplyLevel gives the ratio. If demand = supply, ratio = 1.0. If demand = 8 and supply = 4, ratio = 2.0 (demand is double, prices should rise). Multiplying by 5.0 scales it so equilibrium (ratio = 1) maps to price = 5 (the middle LED). constrain(..., 1.0, 10.0) limits the result to the 1–10 range — prices cannot go negative or off the chart.
Lines 25–33: updateDisplay() — lighting the bargraph
void updateDisplay(int priceLevel) {
  for (int i = 0; i < 10; i++) {
    if (i < priceLevel) {
      digitalWrite(LED_PINS[i], HIGH);
    } else {
      digitalWrite(LED_PINS[i], LOW);
    }
  }
}
for loops through all 10 LEDs. For each one: if its position i is below the current price level, turn it on (HIGH = send electricity). Otherwise turn it off (LOW = no electricity). This creates a bargraph that fills from the bottom up — exactly like a volume bar on a music app.
Lines 35–62: setup() — morning routine
for (int i = 0; i < 10; i++) {
  pinMode(LED_PINS[i], OUTPUT);
  digitalWrite(LED_PINS[i], LOW);
}
Set all 10 LED legs to output mode (they send electricity out, not read it in). Turn them all off to start.
pinMode(BTN_D_UP, INPUT_PULLUP);Four times, once per button. INPUT_PULLUP means the leg reads HIGH normally and LOW when the button is pressed.
for (int i = 0; i < 10; i++) {
  digitalWrite(LED_PINS[i], HIGH);
  delay(100);
}
for (int i = 9; i >= 0; i--) {
  digitalWrite(LED_PINS[i], LOW);
  delay(100);
}
A startup animation: light LEDs one by one from bottom to top (100ms per step), then turn them off one by one from top to bottom. i-- means “subtract 1 from i each step” — the reverse of i++. This sweeps up then sweeps down, like a price negotiation settling.
updateDisplay(5);Start the bargraph at level 5 (middle) — the equilibrium starting point.
Lines 66–110: loop() — button reading and price simulation
if (millis() - lastButton > 300) {
  bool changed = false;
  if (digitalRead(BTN_D_UP) == LOW) {
    demandLevel = min(demandLevel + 0.5, 10.0);
    changed = true;
  }
Only check buttons if at least 300ms has passed since the last press — this is debouncing. min(demandLevel + 0.5, 10.0) adds 0.5 but caps at 10 — min() returns the smaller of two values, so the result can never exceed 10. changed = true flags that something changed.
  if (changed) {
    lastButton = millis();
    targetPrice = calculateEquilibrium();
    float ratio = demandLevel / supplyLevel;
    if (ratio > 1.5) marketStatus = "SHORTAGE";
    else if (ratio < 0.67) marketStatus = "SURPLUS";
    else marketStatus = "Equilibrium";
  }
When a button is pressed: update the target price using the formula. Determine the market status. ratio > 1.5 means demand is 50% higher than supply — that is a shortage. ratio < 0.67 means supply is 50% higher than demand — surplus. Otherwise: equilibrium. Serial.printf prints all four values in a formatted line.
if (millis() - lastPriceUpdate > 500) {
  lastPriceUpdate = millis();
  if (abs(price - targetPrice) > 0.1) {
    price += (targetPrice - price) * 0.3;
  }
  int displayLevel = constrain((int)round(price), 1, 10);
  updateDisplay(displayLevel);
Every 500ms, nudge the displayed price 30% closer to the target. abs(price - targetPrice) > 0.1 stops the nudging once the price is close enough — otherwise it would keep inching forever and never quite arrive. (int)round(price) rounds to the nearest whole number (1–10 for the 10 LEDs). constrain(...) keeps it in the valid 1–10 range.
  priceHistory[historyIdx % 50] = price;
  historyIdx++;
Store the current price in a rotating 50-slot history. historyIdx % 50 wraps back to 0 after slot 49 — the oldest value gets overwritten by the newest.
The whole thing in one sentence
On power-on, run a sweep animation and start at equilibrium price 5 (setup). Then forever, check four buttons and adjust supply/demand when pressed, then every 500ms move the displayed price 30% closer to the calculated equilibrium and update the LED bargraph (loop).
First thing to try: Upload and press “Demand Up” four times quickly. Watch the LEDs climb slowly over about 2–3 seconds instead of jumping — that is the market adjustment lag. Then press “Supply Up” four times and watch them fall back. That 30% step size is the key — change it to 1.0 (100%) and the price will jump instantly with no lag.
Check: Upload and press the Demand Up button several times. The LED bars should climb. Press Supply Up several times — bars should fall back. If LEDs don’t light, check resistor placement and GPIO pin numbers.
Step 3: Label your buttons
Make four labeled button cards:
- DEMAND ▲ — “More buyers want the product”
- DEMAND ▼ — “Buyers lose interest”
- SUPPLY ▲ — “More producers enter the market”
- SUPPLY ▼ — “Production decreases”
Also label the LED bargraph:
- Bottom 3 (green): “Low price (surplus)”
- Middle 4 (yellow): “Market equilibrium”
- Top 3 (red): “High price (shortage)”
Step 4: Present it!
Demo scenarios for your presentation:
Scenario 1 — Hype cycle: Start at equilibrium (5 LEDs). Press Demand Up 4 times. Watch price climb. Say: “This is what happens when a new iPhone releases — demand spikes, supply stays the same, price shoots up.”
Scenario 2 — Commodity crash: Press Supply Up 4 times. Watch price fall. “This is what happened to oil prices in 2020 — supply overwhelmed demand.”
Scenario 3 — Price ceiling: Manually set supply to 3, demand to 8 (shortage — top LEDs lit). Say: “This is a persistent shortage. In rent-controlled markets, demand stays high but supply never rises because prices are fixed by law.”
Presentation tip: Hand the controls to your audience. Let them create their own economic scenarios. Say: “Try to cause a shortage. Now try to create a surplus. Now find equilibrium again.” Experiential learning sticks.
What just happened
You built a dynamic systems simulation — a model where variables change over time based on relationships between them. The 30% approach to equilibrium per step is called a first-order lag — common in economics, ecology, and engineering (how temperatures reach equilibrium, how populations stabilize).
The constrain() function enforces the boundaries of your model (price between 1 and 10). In real economics, price floors (minimum wage) and price ceilings (rent control) are exactly this kind of constraint applied by law.
Curriculum connections:
- Common Core Economics Standard: Supply and demand, market equilibrium, price signals
- Common Core Math 8.F.A.1: Understand that a function is a rule that assigns to each input exactly one output
- NGSS Science Practice 2: Developing and using models
The market adjustment lag (30% per step) models the fact that real prices don’t jump instantly — there’s friction (contracts, information delays, transaction costs). This “sticky prices” concept is important in macroeconomics.
Level Up
Elasticity slider: Add a potentiometer (variable resistor, $1). Rotate it to change how sensitive price is to supply/demand shifts. Demonstrate elastic vs. inelastic demand.
Scenario playback: Add a button that runs pre-programmed scenarios automatically (oil shock, housing boom, etc.) with text descriptions on an OLED screen.
Two-market comparison: Build a second unit. Run the same scenarios on both. Show how interconnected markets affect each other (when oil prices rise, gas prices follow).
Troubleshooting
| Problem | Fix |
|---|---|
| LEDs don’t light | Check 220Ω resistors. Check GPIO numbers match code. All cathodes to GND. |
| Buttons not responding | Check INPUT_PULLUP. Button must connect GPIO to GND. Increase debounce if double-triggering. |
| Price doesn’t change | Verify calculateEquilibrium() returns different values when supply/demand change. Add Serial.println debugging. |
| Upload fails | Hold BOOT button while clicking Upload. |