Parent info
Parts you need
Affiliate links — we may earn a small commission
Try this circuit in your browser!
Run the code, press the buttons and watch what happens — before you buy any parts. No account needed.
Open in Simulator →Your classmates said plants need light. You measured exactly how much.
Imagine this: Biology class, photosynthesis unit. Everyone watches the floating leaf disk experiment — disks float when photosynthesis produces oxygen. You write down: “more light = more photosynthesis.” Observable. Qualitative.
Your setup is different. You have a sealed chamber with a plant, a light sensor measuring exact lux, and a gas sensor tracking oxygen changes. You test 6 different light levels and plot the light response curve — the exact relationship between lux input and photosynthesis output.
“At 800 lux, the plant’s photosynthetic rate plateaued. Below 200 lux, it was barely above zero.” That’s quantitative biology. That’s publishable.
That’s what we’re building. For about $30.
What you’ll need
| Part | What it does | Price |
|---|---|---|
| ESP32-S3-DevKitC-1 | Brain — reads sensors, serves data dashboard | ~$12 |
| BH1750 light sensor | Measures exact lux (light intensity) | ~$4 |
| MQ-135 sensor | Tracks air composition changes (CO2/O2 proxy) | ~$4 |
| OLED display 0.96” | Shows readings in real time | ~$4 |
| Breadboard + jumper wires | Connects everything | ~$5 |
| 10kΩ + 20kΩ resistors | Turn the gas sensor’s 5V signal into a safe 3.3V | ~$1 |
You also need: clear plastic box or mason jar (sealed chamber), aquatic plant (Elodea/waterweed, $2 from pet store), desk lamp, USB battery bank.
Total: ~$31 | Time: ~2–3 hours | Difficulty: ●●●○○
How it works (60 seconds)
Plants perform photosynthesis: CO2 + water + light → glucose + oxygen. More light = faster photosynthesis = more O2 produced.
We can’t directly measure O2 easily with cheap sensors. But we can measure CO2 dropping (plants consume it) and correlate that with light intensity. The BH1750 gives us the exact lux value of the light hitting the plant. The MQ-135 tracks the gas composition in the sealed chamber changing over time.
The relationship between light intensity and photosynthetic rate follows a light-response curve: zero at darkness, linear increase at low light, then plateauing at light saturation point (the plant can’t photosynthesize faster even with more light).
Step 0: Set up your experiment chamber
Time: ~30 minutes
Build the measurement chamber:
- Get a clear plastic container with a lid (1-quart mason jar works great)
- Place a small aquatic plant (Elodea) inside with some water
- Drill/poke a small hole in the lid for the sensor wires
- Seal the hole with putty when measuring
Why aquatic plant? Elodea is available at any pet store (~$2), grows easily, and produces visible bubbles of oxygen when photosynthesizing — a nice visual confirmation your measurement is working.
Light source: A desk lamp with a dimmer, or just move it closer/farther to change intensity. Use the BH1750 to measure the exact lux at the plant’s location.
Test light levels:
| Distance from lamp | Expected lux |
|---|---|
| 5 cm | ~5000 lux |
| 15 cm | ~800 lux |
| 30 cm | ~300 lux |
| 60 cm | ~100 lux |
| 90 cm | ~50 lux |
| Dark (covered) | ~0 lux |
Check: Measure each light level with the sensor BEFORE starting data collection. Record exact lux values — these become your X axis.
Step 1: Wire it up
Time: ~10 minutes
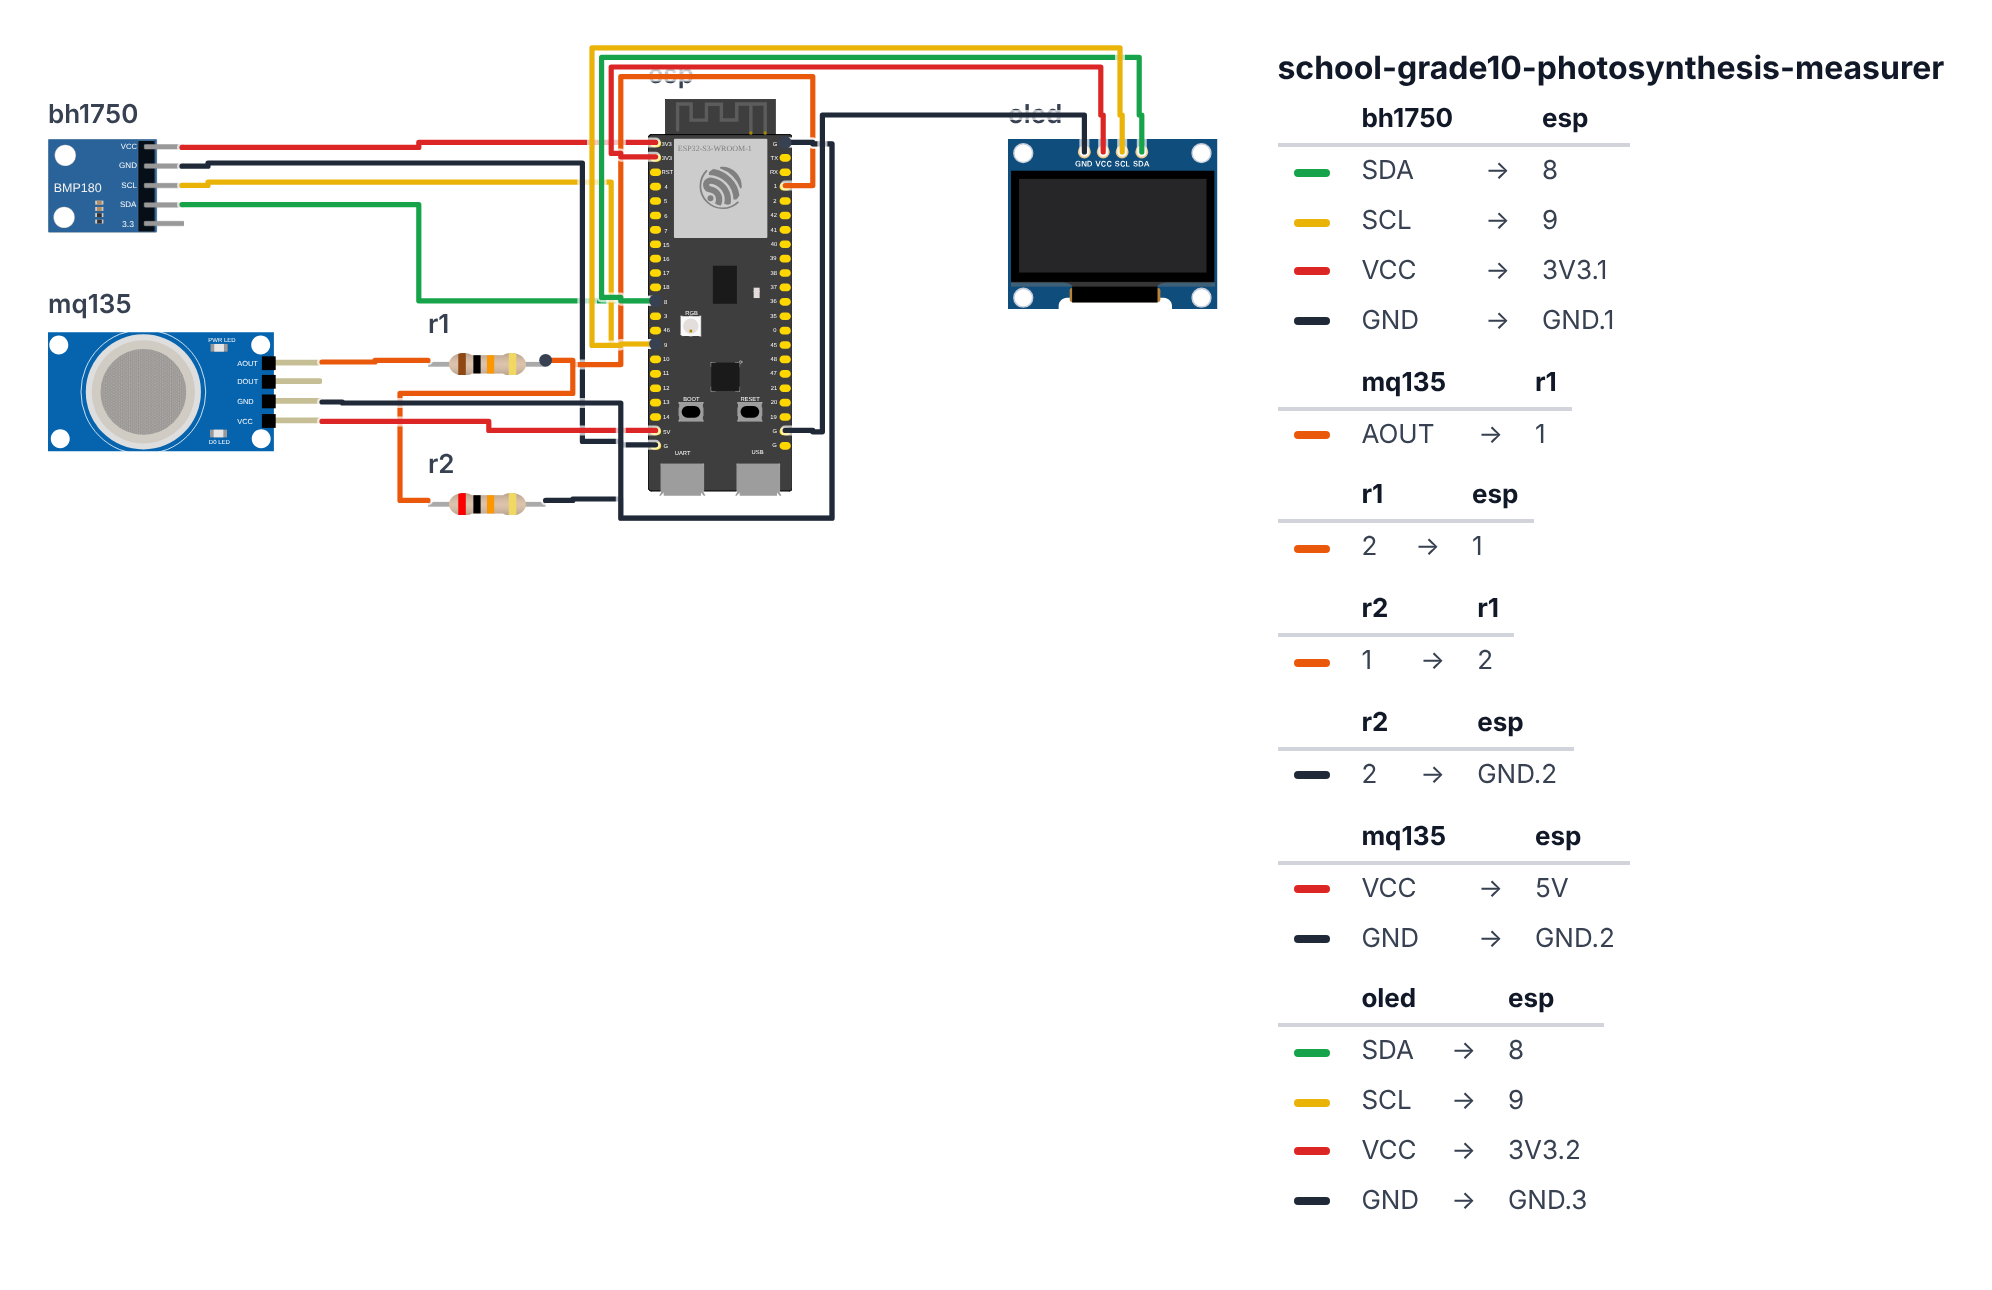
Both BH1750 and OLED use I2C. Add MQ-135 on an analog pin.
BH1750:
- SDA → board GPIO 8 (C6: GPIO 6)
- SCL → board GPIO 9 (C6: GPIO 7)
- VCC → 3.3V
- GND → GND
OLED: 5. SDA → board GPIO 8 (C6: GPIO 6) (same I2C bus) 6. SCL → board GPIO 9 (C6: GPIO 7) (same I2C bus) 7. VCC → 3.3V 8. GND → GND
MQ-135: 9. AOUT → 10kΩ resistor → board GPIO 1 10. 20kΩ resistor from board GPIO 1 → GND — so the sensor’s 5V signal becomes a safe 3.3V 11. VCC → 5V 12. GND → GND
Check: BH1750 I2C address = 0x23 (ADDR pin low). OLED = 0x3C. They’re different — no conflict. MQ-135 needs 5V for its heater, so its signal can reach 5V too — the two resistors (steps 9–10) bring it down to 3.3V, the most an ESP32 pin can take. Don’t skip them.
Step 2: Flash the code
Time: ~15 minutes
Install: BH1750 (by Christopher Laws), Adafruit SSD1306, Adafruit GFX Library
The big picture first. This program is a two-sensor photosynthesis lab that logs data to a webpage:
- The BH1750 measures the exact amount of light hitting the plant in lux (the official unit for light intensity).
- The MQ-135 tracks the gas composition inside the sealed chamber — as the plant photosynthesizes, CO2 drops and the reading changes.
- Every 5 seconds, both readings are saved together with a timestamp. After the experiment you download a CSV file and plot the light-response curve.
A program is like a recipe. The computer reads it top to bottom and does exactly what is written, nothing more. Copy this entire recipe into Arduino IDE and upload it:
// ========== CHOOSE YOUR BOARD ==========
// Uncomment the line for YOUR board:
#define BOARD_S3    // ESP32-S3-DevKitC-1
//#define BOARD_C6  // ESP32-C6-DevKitC-1
// ========================================

#ifdef BOARD_S3
  #define PIN_GAS              1
  #define PIN_SDA              8
  #define PIN_SCL              9
#endif
#ifdef BOARD_C6
  #define PIN_GAS              1
  #define PIN_SDA              6
  #define PIN_SCL              7
#endif

#include <Wire.h>
#include <BH1750.h>
#include <Adafruit_GFX.h>
#include <Adafruit_SSD1306.h>
#include <WiFi.h>
#include <WebServer.h>

BH1750 lightMeter;
Adafruit_SSD1306 display(128, 64, &Wire, -1);

const char* ssid = "YOUR_WIFI_NAME";
const char* password = "YOUR_WIFI_PASSWORD";
WebServer server(80);

struct DataPoint {
  float lux;
  int gasVal;
  unsigned long timestamp;
};

DataPoint data[200];
int dataCount = 0;
unsigned long lastSample = 0;

float currentLux = 0;
int currentGas = 0;

void setup() {
  Serial.begin(115200);
  Wire.begin(PIN_SDA, PIN_SCL);
  lightMeter.begin();

  display.begin(SSD1306_SWITCHCAPVCC, 0x3C);
  display.clearDisplay();
  display.setTextColor(SSD1306_WHITE);

  WiFi.begin(ssid, password);
  while (WiFi.status() != WL_CONNECTED) delay(500);
  Serial.println("IP: " + WiFi.localIP().toString());

  server.on("/", []() {
    String html = "<!DOCTYPE html><html><head>";
    html += "<meta name='viewport' content='width=device-width,initial-scale=1'>";
    html += "<title>Photosynthesis Lab</title>";
    html += "<style>body{font-family:sans-serif;padding:20px}table{border-collapse:collapse;width:100%}";
    html += "td,th{border:1px solid #ddd;padding:8px;text-align:right}th{background:#4CAF50;color:white}</style></head><body>";
    html += "<h2>Photosynthesis Light Response Data</h2>";
    html += "<p>Current: <b>" + String(currentLux, 0) + " lux</b> | Gas index: <b>" + String(currentGas) + "</b></p>";
    html += "<table><tr><th>#</th><th>Lux</th><th>Gas Index</th><th>Time (s)</th></tr>";
    for (int i = 0; i < dataCount; i++) {
      html += "<tr><td>" + String(i+1) + "</td><td>" + String(data[i].lux, 1) + "</td>";
      html += "<td>" + String(data[i].gasVal) + "</td>";
      html += "<td>" + String(data[i].timestamp/1000) + "</td></tr>";
    }
    html += "</table><br><a href='/csv'>Download CSV</a></body></html>";
    server.send(200, "text/html", html);
  });

  server.on("/csv", []() {
    String csv = "time_s,lux,gas_index\n";
    for (int i = 0; i < dataCount; i++) {
      csv += String(data[i].timestamp/1000) + "," + String(data[i].lux, 1) + "," + String(data[i].gasVal) + "\n";
    }
    server.send(200, "text/csv", csv);
  });

  server.begin();
}

void loop() {
  server.handleClient();

  currentLux = lightMeter.readLightLevel();
  currentGas = analogRead(PIN_GAS);

  if (millis() - lastSample > 5000 && dataCount < 200) {
    lastSample = millis();
    data[dataCount] = {currentLux, currentGas, millis()};
    dataCount++;
    Serial.println(String(millis()/1000) + "," + String(currentLux, 1) + "," + String(currentGas));
  }

  display.clearDisplay();
  display.setTextSize(1);
  display.setCursor(0, 0);
  display.println("Photosynthesis Lab");

  display.setTextSize(2);
  display.setCursor(0, 16);
  display.println(String(currentLux, 0) + " lx");

  display.setTextSize(1);
  display.setCursor(0, 40);
  display.println("Gas: " + String(currentGas));
  display.setCursor(0, 52);
  display.println("Points: " + String(dataCount));

  display.display();
  delay(200);
}
Line-by-line: what every line does and why
Lines 1–6: Borrowing ready-made instruction books
#include <Wire.h>
#include <BH1750.h>
#include <Adafruit_GFX.h>
#include <Adafruit_SSD1306.h>
#include <WiFi.h>
#include <WebServer.h>
#include means “grab this instruction book.” Wire handles I2C. BH1750 knows how to read the light sensor. Adafruit libraries draw on the OLED. WiFi and WebServer let the ESP32 serve a data table to any browser on your network.
Lines 8–9: Creating the sensor and display objects
BH1750 lightMeter;
Adafruit_SSD1306 display(128, 64, &Wire, -1);
lightMeter is the name we give the light sensor. display is the OLED (128×64 pixels, I2C bus, no reset pin). From now on, lightMeter.readLightLevel() asks the sensor for the current lux value.
Lines 14–15: The gas sensor pin
#define PIN_GAS 1The MQ-135 signal wire plugs into ESP32 leg 1. #define gives it an easy name — so if you rewire it to a different leg, you only change this one line.
Lines 17–22: The data structure
struct DataPoint {
  float lux;
  int gasVal;
  unsigned long timestamp;
};
DataPoint data[200];
struct is like a custom box with labeled compartments. Each DataPoint holds three values together: the lux reading, the gas reading, and the timestamp. Instead of three separate arrays, one DataPoint keeps everything for one measurement together. data[200] creates 200 of these boxes — enough for 200 data points (about 16 minutes at 5-second intervals).
Lines 26–42: setup() — morning routine
Wire.begin(PIN_SDA, PIN_SCL);
lightMeter.begin();
display.begin(SSD1306_SWITCHCAPVCC, 0x3C);
Start the I2C bus on legs 8 and 9 (C6: legs 6 and 7). Start the light meter (it auto-configures). Start the display at I2C address 0x3C.
WiFi.begin(ssid, password);
while (WiFi.status() != WL_CONNECTED) delay(500);
Serial.println("IP: " + WiFi.localIP().toString());
Connect to WiFi and wait until connected. Print the IP address — you will type this into your phone’s browser.
server.on("/", []() {
  String html = "...";
  server.send(200, "text/html", html);
});
server.on("/", ...) registers what to do when someone visits the main page. The []() is a lambda — a mini function with no name, defined right here inline. It builds the HTML table with all stored data points and sends it to the browser. 200 means “OK.” Every row in the table comes from the data[] array.
server.on("/csv", []() {
  String csv = "time_s,lux,gas_index\n";
  for (int i = 0; i < dataCount; i++) {
    csv += String(data[i].timestamp/1000) + "," + ...
  }
  server.send(200, "text/csv", csv);
});
The /csv route builds a downloadable CSV file. data[i].timestamp/1000 converts milliseconds to seconds. Each row ends with \n (newline). "text/csv" tells the browser to treat it as a spreadsheet file.
Lines 44–73: loop() — runs forever
server.handleClient();Check if any phone sent a web request and answer it. This must run on every loop iteration or the web server stops responding.
currentLux = lightMeter.readLightLevel();
currentGas = analogRead(PIN_GAS);
readLightLevel() returns the current light intensity in lux — already calibrated, no math needed. analogRead(PIN_GAS) reads the MQ-135 voltage and converts it to 0–4095.
if (millis() - lastSample > 5000 && dataCount < 200) {
  lastSample = millis();
  data[dataCount] = {currentLux, currentGas, millis()};
  dataCount++;
  Serial.println(String(millis()/1000) + "," + String(currentLux, 1) + "," + String(currentGas));
}
Every 5 seconds (5,000 ms), store a new data point. data[dataCount] = {currentLux, currentGas, millis()} fills all three compartments of one DataPoint struct at once — like filling in three columns of one spreadsheet row. dataCount < 200 prevents writing past the end of the array.
display.clearDisplay();
display.println("Photosynthesis Lab");
display.setTextSize(2);
display.println(String(currentLux, 0) + " lx");
display.setTextSize(1);
display.println("Gas: " + String(currentGas));
display.println("Points: " + String(dataCount));
display.display();
Show the live lux reading in large text, gas index in small text, and the count of stored data points. display.display() actually pushes everything to the screen — without this, the screen stays blank.
The whole thing in one sentence
On power-on, start the two sensors and connect to WiFi, then serve a data table to any phone browser (setup). Then forever, read both sensors continuously, save a snapshot every 5 seconds, display the live lux on the OLED, and answer web requests (loop).
First thing to try: After uploading, find the IP in Serial Monitor and open it in your phone. You should see a table. Shine a flashlight at the BH1750 sensor and watch the lux value jump on the OLED. Then block the sensor with your hand and watch it drop to near zero. This confirms the light sensor is working before you start the actual experiment.
Step 3: Run the experiment
Time: ~30 minutes
Protocol (follow exactly for valid data):
- Place plant in sealed chamber, let it adapt for 5 minutes
- Start at highest light level. Record 3 minutes of data.
- Move to next light level. Wait 2 minutes for readings to stabilize.
- Record 3 more minutes.
- Repeat for all 6 light levels.
- Download CSV from
/csv
In Google Sheets:
- Plot lux (X axis) vs. gas index (Y axis)
- You should see a curve that rises steeply at first, then flattens
- That flat part is the light saturation point — your plant’s maximum photosynthetic rate
Presentation tip: Show the light-response curve graph. Mark the light saturation point. Say: “This is the same curve published in biology textbooks. I measured mine. My plant’s saturation point is approximately [X] lux — which means you’d need a grow light of at least [X] lux for optimal growth. A typical classroom window provides about [Y] lux — which is [above/below] that threshold.”
What just happened
The BH1750 uses a photodiode — a semiconductor that generates current proportional to light intensity. It converts this to a digital value in lux (the SI unit of illuminance) via an internal ADC. Clean I2C output, no calibration needed.
The light-response curve follows Michaelis-Menten kinetics — the same equation used in enzyme kinetics. Rate = Vmax × [S] / (Km + [S]). In your case, light replaces substrate concentration. This math appears in biochemistry, pharmacology, and economics (diminishing returns).
Curriculum connections:
- NGSS HS-LS1-5: Use a model to illustrate how photosynthesis transforms light energy into stored chemical energy
- NGSS HS-LS2-5: Develop a model to illustrate the role of photosynthesis and cellular respiration in the cycling of carbon
- AP Biology: Photosynthesis, light reactions, electron transport chain
Level Up
Compare plant species: Test Elodea vs. Spinach leaf vs. Pothos. Which saturates at lower light?
CO2 concentration variable: Instead of light, vary CO2 by adding different amounts of baking soda + vinegar in the chamber. Plot CO2 vs. photosynthetic rate.
Temperature effect: Run the same experiment with the chamber at 15°C (ice bath) vs. 25°C (room temp) vs. 35°C (warm water bath). Plot three curves on the same graph.
Troubleshooting
| Problem | Fix |
|---|---|
| BH1750 reads 0 | Check SDA/SCL wiring. Try lightMeter.begin(BH1750::CONTINUOUS_HIGH_RES_MODE). |
| Gas values don’t change | MQ-135 needs 2+ min warmup. Seal the chamber better — loose lid means the gas diffuses out too fast. |
| No WiFi connection | Check SSID/password. ESP32 only connects to 2.4GHz networks. |
| OLED blank | Try I2C address 0x3D if 0x3C fails. Check 3.3V power. |
| Upload fails | Hold BOOT button while clicking Upload. |