Parent info
Parts you need
Affiliate links — we may earn a small commission
Try this circuit in your browser!
Run the code, press the buttons and watch what happens — before you buy any parts. No account needed.
Open in Simulator →Your classmates used a stopwatch. You have a data logger.
Imagine this: Chemistry lab. Reaction rate experiment. Everyone drops Alka-Seltzer in water and times how long until bubbling stops with a stopwatch. One data point per trial. Rough.
You drop the tablet and your DS18B20 records temperature every second for 5 minutes. You get 300 data points. You plot the curve: temperature rises 2.3°C in 45 seconds (exothermic), then slowly returns to baseline. You compare cold water vs. hot water vs. salt water. You show the effect of temperature on reaction rate — with actual temperature measurements, not just observation.
That’s what we’re building. For about $22.
What you’ll need
| Part | What it does | Price |
|---|---|---|
| ESP32-S3-DevKitC-1 | Brain — reads temperature, logs data, serves web | ~$12 |
| DS18B20 waterproof probe | Accurate ±0.5°C, goes directly in the beaker | ~$4 |
| OLED display 0.96” | Shows live temperature and rate | ~$4 |
| Breadboard + jumper wires | Wires everything | ~$5 |
You also need: 4.7kΩ resistor (comes with most breadboard kits), beakers or glasses, Alka-Seltzer tablets, water at different temperatures.
Total: ~$22 | Time: ~1–2 hours | Difficulty: ●●○○○
How it works (60 seconds)
The DS18B20 is a digital thermometer in a waterproof stainless steel probe. It communicates on a 1-Wire bus — one data wire, plus power and ground. The sensor contains a tiny computer that measures temperature and sends it as a precise digital number (±0.5°C accuracy).
When a reaction is exothermic (releases heat), the water temperature rises. The faster the reaction, the faster the temperature rises. By measuring temperature every second, you can calculate the rate (°C per second = proxy for reaction speed).
Step 0: Design your experiment
Hypothesis options (pick one):
- “Higher initial water temperature = faster reaction rate (measured by °C rise per second)”
- “Crushed tablet reacts faster than whole tablet”
- “Salt water changes the reaction rate vs. plain water”
Variables:
| Condition | Water temp | Tablet form | Salt? |
|---|---|---|---|
| Trial A | Cold (5°C) | Whole | No |
| Trial B | Room (22°C) | Whole | No |
| Trial C | Hot (50°C) | Whole | No |
| Trial D | Room (22°C) | Crushed | No |
Run each trial twice and average the results.
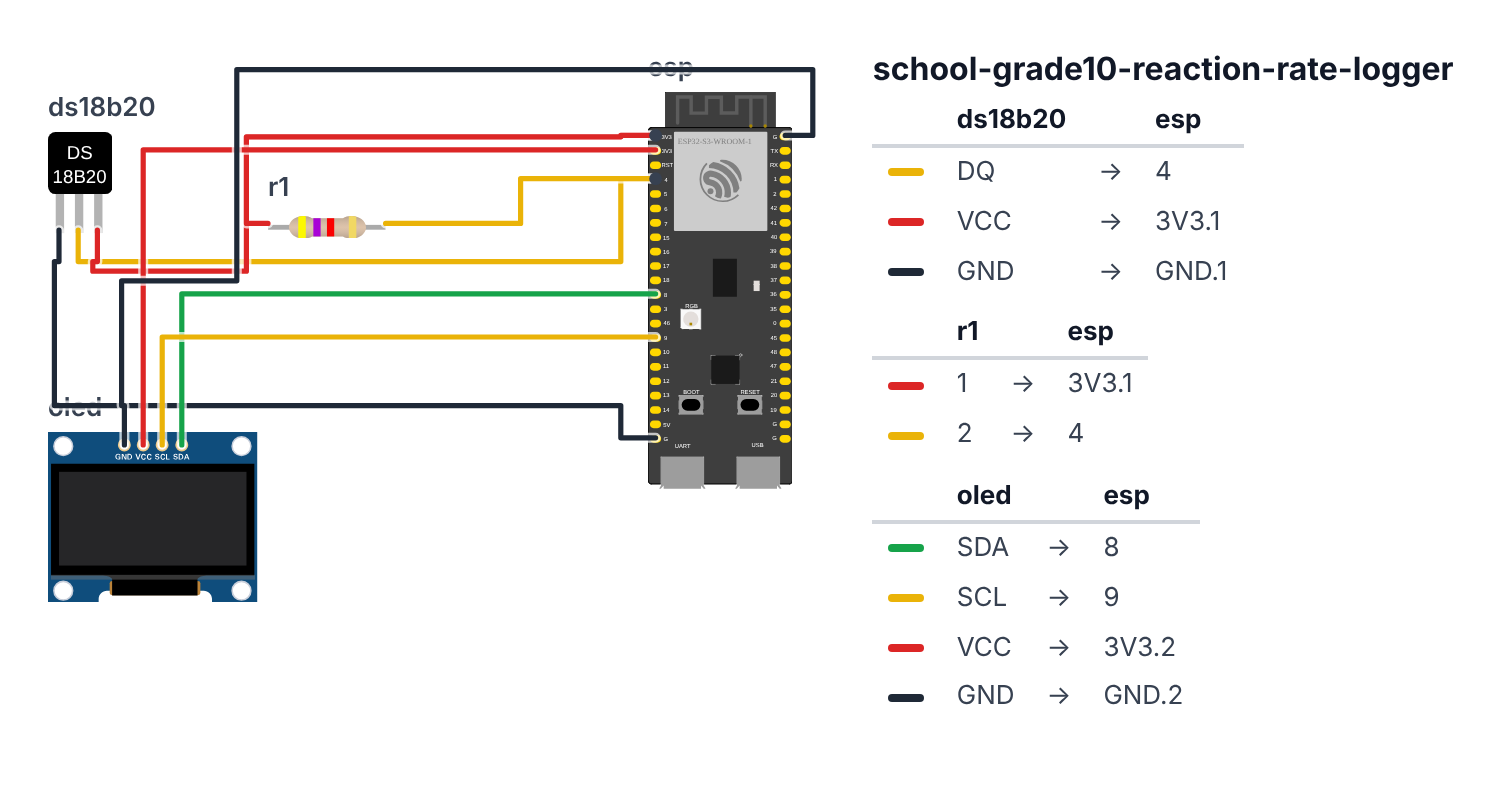
Step 1: Wire it up
Time: ~10 minutes
The DS18B20 has 3 wires in a specific order (check your sensor’s datasheet):
- Red = VCC (3.3V)
- Black = GND
- Yellow/White = Data (one-wire signal)
- DS18B20 Red → 3.3V
- DS18B20 Black → GND
- DS18B20 Yellow → board GPIO 4 (C6: GPIO 0)
- 4.7kΩ resistor between GPIO 4 (C6: GPIO 0) and 3.3V (pull-up — REQUIRED)
OLED: 5. SDA → board GPIO 8 (C6: GPIO 6) 6. SCL → board GPIO 9 (C6: GPIO 7) 7. VCC → 3.3V 8. GND → GND
Check: The 4.7kΩ pull-up resistor is not optional — without it, the 1-Wire protocol won’t work. Most breadboard component kits include resistors; look for “4.7K” or color code: yellow-violet-red.
Step 2: Flash the code
Time: ~20 minutes
Install libraries: OneWire (by Paul Stoffregen), DallasTemperature, Adafruit SSD1306, Adafruit GFX Library
The big picture first. This program is a web-controlled chemistry data logger:
- The DS18B20 probe sits in the beaker and reports the water temperature once per second.
- The web interface on your phone shows the live temperature and has Start/Stop buttons — so you can control the recording while your hands are busy dropping the tablet.
- After the trial, you download a CSV file with every second of data, including how many degrees the temperature changed from baseline.
A program is like a recipe. The computer reads it top to bottom and does exactly what is written, nothing more. Copy this entire recipe into Arduino IDE and upload it:
// ========== CHOOSE YOUR BOARD ==========
// Uncomment the line for YOUR board:
#define BOARD_S3    // ESP32-S3-DevKitC-1
//#define BOARD_C6  // ESP32-C6-DevKitC-1
// ========================================

#ifdef BOARD_S3
  #define PIN_ONEWIRE          4
  #define PIN_SDA              8
  #define PIN_SCL              9
#endif
#ifdef BOARD_C6
  #define PIN_ONEWIRE          0
  #define PIN_SDA              6
  #define PIN_SCL              7
#endif

#include <OneWire.h>
#include <DallasTemperature.h>
#include <Wire.h>
#include <Adafruit_GFX.h>
#include <Adafruit_SSD1306.h>
#include <WiFi.h>
#include <WebServer.h>

OneWire oneWire(PIN_ONEWIRE);
DallasTemperature sensors(&oneWire);
Adafruit_SSD1306 display(128, 64, &Wire, -1);

const char* ssid = "YOUR_WIFI_NAME";
const char* password = "YOUR_WIFI_PASSWORD";
WebServer server(80);

float tempLog[600];
unsigned long timeLog[600];
int logCount = 0;
bool recording = false;
float baselineTemp = 0;
unsigned long recordStart = 0;

void startRecording() {
  logCount = 0;
  recording = true;
  recordStart = millis();
  sensors.requestTemperatures();
  baselineTemp = sensors.getTempCByIndex(0);
  Serial.println("Recording started. Baseline: " + String(baselineTemp, 2) + "C");
}

void stopRecording() {
  recording = false;
  Serial.println("Recording stopped. " + String(logCount) + " points.");
}

void setup() {
  Serial.begin(115200);
  sensors.begin();
  Wire.begin(PIN_SDA, PIN_SCL);
  display.begin(SSD1306_SWITCHCAPVCC, 0x3C);

  WiFi.begin(ssid, password);
  while (WiFi.status() != WL_CONNECTED) delay(500);
  Serial.println("IP: " + WiFi.localIP().toString());

  server.on("/", []() {
    String html = "<!DOCTYPE html><html><head><meta name='viewport' content='width=device-width,initial-scale=1'>";
    html += "<title>Reaction Logger</title>";
    html += "<style>body{font-family:sans-serif;padding:20px}button{padding:12px 20px;margin:5px;font-size:16px;border-radius:6px;border:none;cursor:pointer}";
    html += ".start{background:#4CAF50;color:white}.stop{background:#f44336;color:white}.dl{background:#2196F3;color:white}</style></head><body>";
    html += "<h2>Reaction Rate Logger</h2>";

    sensors.requestTemperatures();
    float t = sensors.getTempCByIndex(0);
    html += "<p>Current temp: <b>" + String(t, 2) + " C</b></p>";
    html += "<p>Status: <b>" + String(recording ? "RECORDING" : "IDLE") + "</b> | Points: " + String(logCount) + "</p>";
    html += "<button class='start' onclick=\"fetch('/start')\">Start Recording</button>";
    html += "<button class='stop' onclick=\"fetch('/stop')\">Stop Recording</button>";
    html += "<button class='dl' onclick='window.location=\"/csv\"'>Download CSV</button>";
    html += "</body></html>";
    server.send(200, "text/html", html);
  });

  server.on("/start", []() {
    startRecording();
    server.send(200, "text/plain", "started");
  });

  server.on("/stop", []() {
    stopRecording();
    server.send(200, "text/plain", "stopped");
  });

  server.on("/csv", []() {
    String csv = "time_s,temp_C,delta_C\n";
    for (int i = 0; i < logCount; i++) {
      csv += String(timeLog[i]/1000.0, 1) + "," + String(tempLog[i], 2) + "," + String(tempLog[i] - baselineTemp, 2) + "\n";
    }
    server.send(200, "text/csv", csv);
  });

  server.begin();
  display.clearDisplay();
  display.display();
}

unsigned long lastSample = 0;

void loop() {
  server.handleClient();

  if (millis() - lastSample > 1000) {
    lastSample = millis();
    sensors.requestTemperatures();
    float temp = sensors.getTempCByIndex(0);

    if (recording && logCount < 600) {
      tempLog[logCount] = temp;
      timeLog[logCount] = millis() - recordStart;
      logCount++;
      Serial.println(String(timeLog[logCount-1]/1000.0, 1) + "," + String(temp, 2));
    }

    display.clearDisplay();
    display.setTextSize(1);
    display.setCursor(0, 0);
    display.println(recording ? "RECORDING" : "READY");

    display.setTextSize(2);
    display.setCursor(0, 16);
    display.println(String(temp, 1) + " C");

    if (recording && logCount > 0) {
      float delta = temp - baselineTemp;
      display.setTextSize(1);
      display.setCursor(0, 40);
      display.println("Change: +" + String(delta, 2) + " C");
      display.setCursor(0, 52);
      display.println("t=" + String((millis()-recordStart)/1000) + "s n=" + String(logCount));
    }

    display.display();
  }
}
Line-by-line: what every line does and why
Lines 1–7: Borrowing ready-made instruction books
#include <OneWire.h>
#include <DallasTemperature.h>
#include <Wire.h>
#include <Adafruit_GFX.h>
#include <Adafruit_SSD1306.h>
#include <WiFi.h>
#include <WebServer.h>
#include means “grab this instruction book.” OneWire handles the 1-Wire communication protocol — a clever way to send digital data over a single wire. DallasTemperature knows how to talk to DS18B20 sensors specifically (Dallas was the company that invented them). The rest handle the display, WiFi, and web server.
Lines 9–12: Sensor and display setup
#define PIN_ONEWIRE          4
OneWire oneWire(PIN_ONEWIRE);
DallasTemperature sensors(&oneWire);
Adafruit_SSD1306 display(128, 64, &Wire, -1);
PIN_ONEWIRE 4 means the sensor data wire plugs into leg 4 (C6: leg 0). OneWire oneWire(PIN_ONEWIRE) creates the 1-Wire bus on that leg. DallasTemperature sensors(&oneWire) creates the temperature sensor system using that bus — the & means “use the address of oneWire, do not copy it.” Think of it like giving someone directions to a location rather than moving the location.
Lines 17–23: Data storage
float tempLog[600];
unsigned long timeLog[600];
int logCount = 0;
bool recording = false;
float baselineTemp = 0;
unsigned long recordStart = 0;
Two shelves of 600 compartments: one for temperatures, one for timestamps. 600 entries at 1 per second = 10 minutes of data. recording is a true/false flag. baselineTemp is the water temperature at the moment you tap “Start” — all delta calculations compare against this. recordStart is the clock time when recording began — so timestamps in the CSV are “seconds since start,” not “milliseconds since power-on.”
Lines 25–31: startRecording() and stopRecording()
void startRecording() {
  logCount = 0;
  recording = true;
  recordStart = millis();
  sensors.requestTemperatures();
  baselineTemp = sensors.getTempCByIndex(0);
}
Reset the log count to 0 (start fresh). Set the recording flag. Save the current time as the start reference. sensors.requestTemperatures() tells the DS18B20 to start measuring — it takes about 750ms to complete a 12-bit temperature conversion. getTempCByIndex(0) retrieves the result from the first (index 0) sensor on the bus.
void stopRecording() {
  recording = false;
}
Just flip the flag. The data stays in the arrays until the next Start.
Lines 33–90: setup() — morning routine
sensors.begin();
Wire.begin(PIN_SDA, PIN_SCL);
display.begin(SSD1306_SWITCHCAPVCC, 0x3C);
Start the temperature sensor library. Start the I2C bus on legs 8 and 9 (C6: legs 6 and 7). Start the display at address 0x3C.
WiFi.begin(ssid, password);
while (WiFi.status() != WL_CONNECTED) delay(500);
Serial.println("IP: " + WiFi.localIP().toString());
Connect to WiFi. Keep waiting, checking every 500 ms, until connected. Print the IP address — you need this to open the control panel on your phone.
server.on("/", []() { ... server.send(200, "text/html", html); });Register the main page handler using a lambda — a mini function with no name, written right inside the parentheses. Every time a phone visits the main page, it reads the live temperature and shows Start/Stop/Download buttons.
server.on("/start", []() {
  startRecording();
  server.send(200, "text/plain", "started");
});
When the phone taps “Start Recording,” it sends a request to /start. This handler calls startRecording() and sends back “started” as confirmation.
server.on("/csv", []() {
  String csv = "time_s,temp_C,delta_C\n";
  for (int i = 0; i < logCount; i++) {
    csv += String(timeLog[i]/1000.0, 1) + "," + String(tempLog[i], 2) + "," + String(tempLog[i] - baselineTemp, 2) + "\n";
  }
  server.send(200, "text/csv", csv);
});
Build the download file. timeLog[i]/1000.0 converts milliseconds to seconds. tempLog[i] - baselineTemp is the temperature change from the start — your ΔT column. \n ends each row. The three columns become your X, Y1, Y2 in Google Sheets.
Lines 92–127: loop() — runs forever
server.handleClient();Must be in every loop() iteration — this is what makes the web server respond to phone taps.
if (millis() - lastSample > 1000) {
  lastSample = millis();
  sensors.requestTemperatures();
  float temp = sensors.getTempCByIndex(0);
Every second, ask the sensor for a new reading. requestTemperatures() triggers the measurement. getTempCByIndex(0) retrieves the result in Celsius.
  if (recording && logCount < 600) {
    tempLog[logCount] = temp;
    timeLog[logCount] = millis() - recordStart;
    logCount++;
    Serial.println(String(timeLog[logCount-1]/1000.0, 1) + "," + String(temp, 2));
  }
Only save if recording is active AND there is still space in the array. Store the temperature and elapsed time. logCount++ advances the pointer after storing (so it writes to the current slot, then moves forward). Print to Serial for backup.
  display.println(recording ? "RECORDING" : "READY");
  display.setTextSize(2);
  display.println(String(temp, 1) + " C");
  if (recording && logCount > 0) {
    float delta = temp - baselineTemp;
    display.println("Change: +" + String(delta, 2) + " C");
    display.println("t=" + String((millis()-recordStart)/1000) + "s n=" + String(logCount));
  }
  display.display();
Show the status (RECORDING or READY), the big temperature in Celsius with one decimal, and — when recording — the temperature change and elapsed time. display.display() pushes everything to the screen.
The whole thing in one sentence
On power-on, connect to WiFi and register four web routes (setup). Then forever, answer phone requests, and every second read the temperature and — if recording is active — store it in the log and update the display (loop).
First thing to try: After uploading, open the IP in your phone browser. You should see the live temperature. Hold the DS18B20 probe between your fingers — your body temperature (about 37°C) should make the number climb in a few seconds, then fall back when you release it. This confirms the sensor is working before the experiment.
Check: The display should show temperature immediately. If it shows -127°C or 85°C, the sensor isn’t connected correctly or the pull-up resistor is missing.
Step 3: Run your trials
Protocol for each trial:
- Open the web dashboard on your phone
- Prepare beaker with correct water temperature (use kitchen thermometer to verify)
- Put the DS18B20 probe in the water, wait for reading to stabilize (~30 seconds)
- Tap “Start Recording”
- Drop the Alka-Seltzer tablet immediately
- Watch the temperature rise on the OLED
- Wait 3–4 minutes until temperature returns to baseline
- Tap “Stop Recording”
- Download CSV and save it (rename:
trial-cold.csv,trial-hot.csv, etc.)
Repeat for each condition. Each trial is about 5 minutes.
Analysis in Google Sheets:
- Plot all trials on one chart: time (X) vs. temperature (Y)
- Calculate: peak temperature rise (ΔT), time to peak, time to return to baseline
- Higher ΔT / faster peak = faster reaction rate
Presentation tip: Show all four curves on one graph with different colored lines. Point to where the hot water curve rises faster and peaks higher. Say: “The Arrhenius equation in chemistry predicts that a 10°C increase in temperature roughly doubles the reaction rate. My data shows [your result] — consistent with / different from the prediction because [reason].”
What just happened
The DS18B20 uses semiconductor physics to measure temperature. A diode junction voltage changes precisely with temperature. The chip converts this to a 12-bit digital value and sends it via the 1-Wire protocol — all in one tiny sensor.
Activation energy is the energy barrier a chemical reaction must overcome. Higher temperature = more molecules have enough kinetic energy to exceed the barrier = faster reaction. You just measured the Arrhenius relationship experimentally.
Curriculum connections:
- NGSS HS-PS1-5: Apply scientific principles and evidence to provide an explanation about the effects of changing the temperature or concentration of the reacting particles on the rate at which a reaction occurs
- AP Chemistry: Reaction kinetics, Arrhenius equation, activation energy
- Common Core Math: Modeling with functions, rate of change
The shape of your temperature curve (sharp rise, slow decay) is an exponential decay curve — the same math as radioactive decay, Newton’s Law of Cooling, and RC circuits.
Level Up
Calculate rate quantitatively: In your spreadsheet, compute ΔTemp/Δtime for each second. This is the rate of temperature change — a proxy for reaction rate. Plot it. Find the maximum rate point.
Concentration effect: Keep temperature constant, vary tablet concentration (whole vs. half vs. quarter). Plot reaction rate vs. concentration.
Enzyme catalysis: Crush a pineapple and add the juice (contains bromelain enzyme) to your reaction. Does it speed up?
Troubleshooting
| Problem | Fix |
|---|---|
| Reads -127°C | Missing or wrong pull-up resistor. Add 4.7kΩ between data pin and 3.3V. |
| Reads 85°C | Power issue — sensor returns error code 85 when power is insufficient. Check VCC connection. |
| Temperature doesn’t change during reaction | The reaction may be endothermic (cooling). Check your baseline vs. during reaction carefully. |
| Webpage not loading | Check IP in Serial Monitor. Phone must be on same WiFi as ESP32. |
| Upload fails | Hold BOOT button during upload. |