Parent info
Parts you need
Affiliate links — we may earn a small commission
Try this circuit in your browser!
Run the code, press the buttons and watch what happens — before you buy any parts. No account needed.
Open in Simulator →Your classmates drew a timeline. Yours shows the data geographically.
Imagine this: US History project on immigration. Everyone makes a poster with dates and arrows. “1880s: German and Irish. 1900s: Italian and Jewish. 1960s: Latin American and Asian.”
Your project is different. You have a large US map on foam board with LEDs at major immigration destination cities. When you press the “1880s” button, the Rust Belt cities glow bright — representing the steel and coal industry workers. Press “1960s” — California and Texas light up, representing the Hart-Celler Act’s opening to Latin American and Asian immigrants. Each decade tells a different geographic story.
That’s what we’re building. For about $25.
What you’ll need
| Part | What it does | Price |
|---|---|---|
| ESP32-S3-DevKitC-1 | Brain — controls LEDs based on button presses | ~$12 |
| WS2812B LED strip (30 LEDs) | One LED per city on the map | ~$8 |
| Push buttons ×4 | Select decade/era to display | ~$3 |
| Breadboard + jumper wires | Wires it all together | ~$5 |
You also need: large US map printout or foam board, colored marker, hot glue.
Total: ~$25 | Time: ~2–3 hours | Difficulty: ●●●○○
How it works (60 seconds)
Each LED on the strip represents one US city — a major immigration destination. The brightness of each LED corresponds to the relative number of immigrants who settled there in that era. A very bright LED = a major destination. A dim LED = a minor one.
When you press a button for a specific decade, the ESP32 loads that era’s data (brightness values per city) and updates the LEDs. The map visually shows where immigrants settled in that period.
Think of it as a bar chart — but displayed geographically on a map instead of on a graph.
Step 0: Build the historical map
Time: ~60 minutes
This is the core of the project — get the history right first.
Print or draw a large US map (24”×36” foam board). Mark these 20 cities with dots (LED positions):
| LED # | City | Notes |
|---|---|---|
| 0 | New York, NY | Ellis Island — massive all eras |
| 1 | Boston, MA | Irish and Italian hub |
| 2 | Philadelphia, PA | Industrial era hub |
| 3 | Pittsburgh, PA | Steel industry workers |
| 4 | Cleveland, OH | Eastern European workers |
| 5 | Detroit, MI | Auto industry workers |
| 6 | Chicago, IL | Multiple waves — all eras |
| 7 | Milwaukee, WI | German settlement |
| 8 | Minneapolis, MN | Scandinavian settlement |
| 9 | St. Louis, MO | German + Central European |
| 10 | New Orleans, LA | French/Caribbean/Italian |
| 11 | San Antonio, TX | Mexican immigration |
| 12 | Los Angeles, CA | Multiple post-1965 waves |
| 13 | San Francisco, CA | Chinese/Asian immigration |
| 14 | Seattle, WA | Scandinavian + Asian |
| 15 | Denver, CO | Mexican + European |
| 16 | Miami, FL | Cuban + Caribbean |
| 17 | Houston, TX | Mexican + Vietnamese |
| 18 | Atlanta, GA | Latin American (recent) |
| 19 | Washington DC | Political immigrants (recent) |
Research each era: Use your textbook and reliable sources to find which cities received the most immigrants in each period. Brighter LED = more immigrants proportionally.
Step 1: Wire it up
Time: ~15 minutes
LED strip:
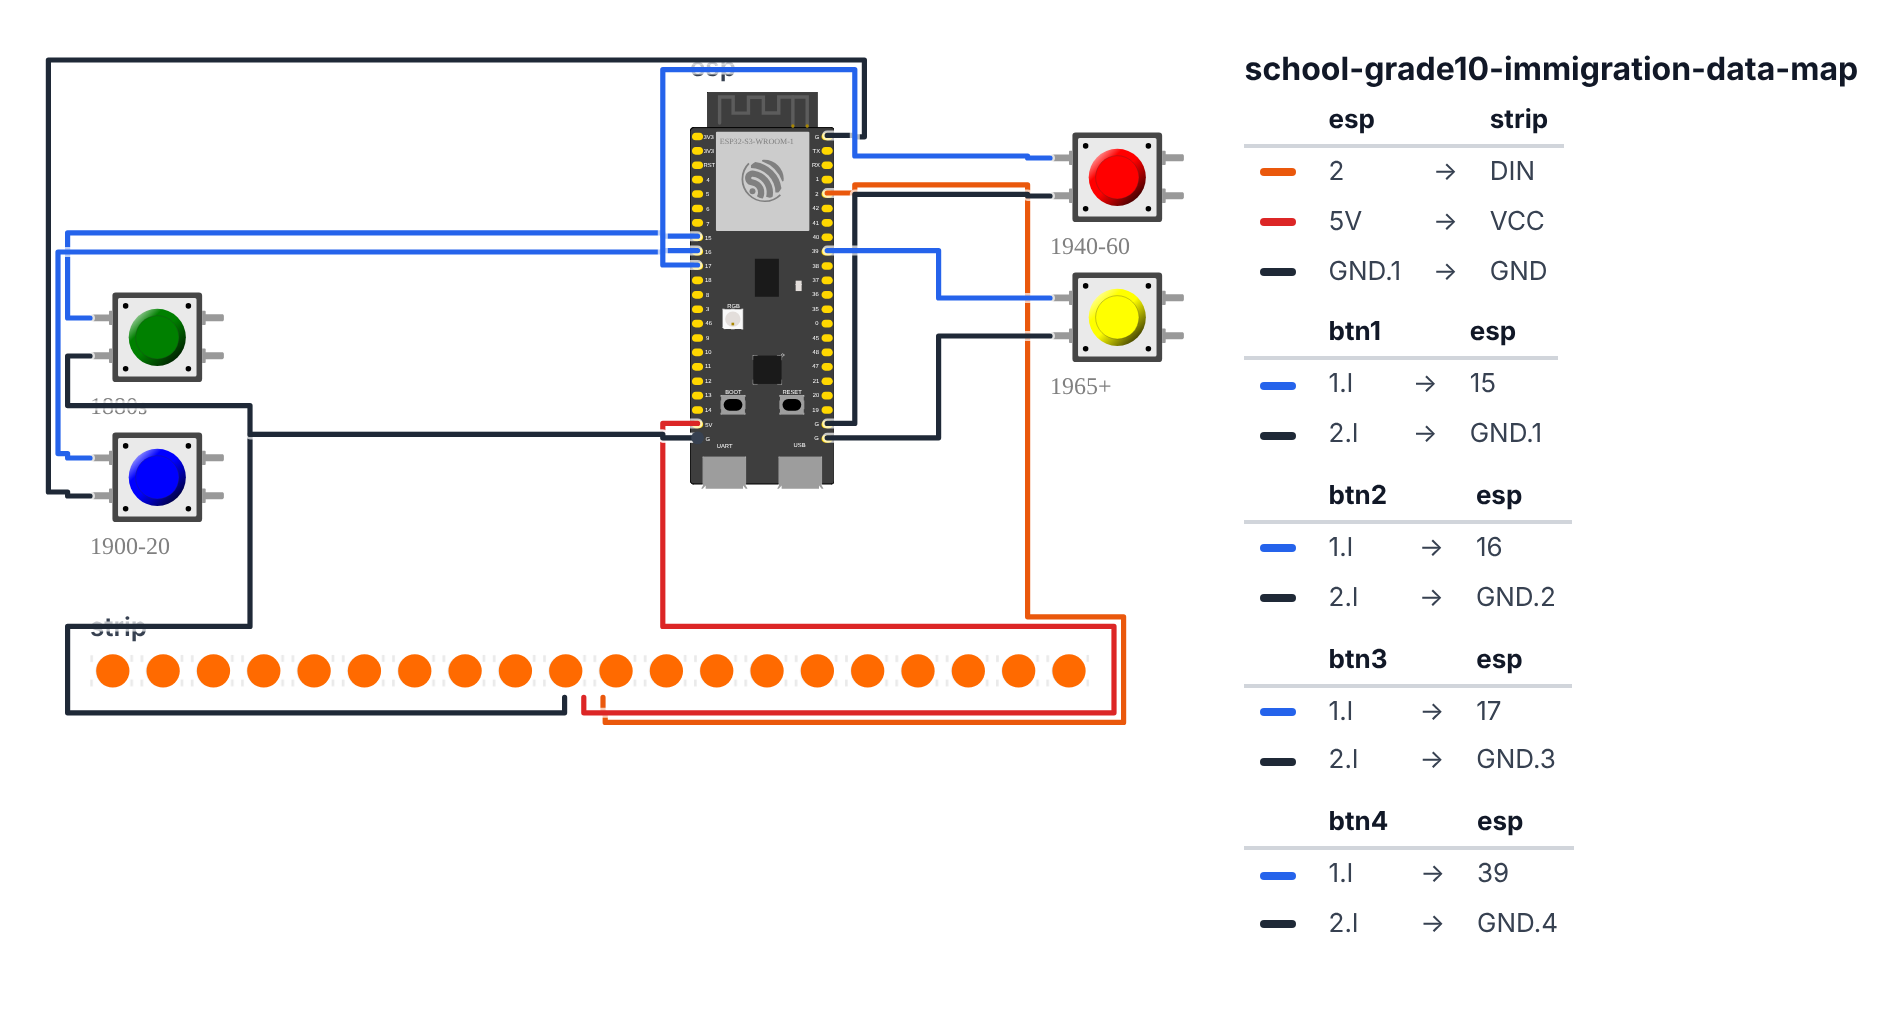
- DIN → board GPIO 2 (C6: GPIO 8)
- VCC → 5V
- GND → GND
4 buttons (each uses the built-in pull-up): 4. Button 1 → board GPIO 15 (C6: GPIO 3) (1880s: First wave — Eastern/Southern European) 5. Button 2 → board GPIO 16 (C6: GPIO 4) (1900–1920: Peak Ellis Island era) 6. Button 3 → board GPIO 17 (C6: GPIO 23) (1940–1960: WWII displaced persons) 7. Button 4 → board GPIO 39 (C6: GPIO 15) (1965–present: Hart-Celler era)
Each button: one side to GPIO pin, other side to GND. Enable internal pull-ups in code.
Check: Four buttons, LED strip. Make sure LED VCC is on 5V. Buttons use 3.3V-compatible GPIO pins — all listed GPIOs are safe.
Step 2: Flash the code
Time: ~20 minutes
Install: FastLED library
The big picture first. This program is a data-driven LED map that changes with history:
- Each LED represents one US city. Its brightness represents how many immigrants settled there in each era — brighter = more immigrants.
- Four buttons select four historical eras. Pressing a button swaps the brightness data and redraws the map instantly.
- The same color is used for all cities in an era, but the
nscale8()function dims each city’s LED differently based on the historical data.
A program is like a recipe. The computer reads it top to bottom and does exactly what is written, nothing more. Copy this entire recipe into Arduino IDE and upload it:
// ========== CHOOSE YOUR BOARD ==========
// Uncomment the line for YOUR board:
#define BOARD_S3    // ESP32-S3-DevKitC-1
//#define BOARD_C6  // ESP32-C6-DevKitC-1
// ========================================

#ifdef BOARD_S3
  #define PIN_NEOPIXEL         2
  #define PIN_BTN1             15
  #define PIN_BTN2             16
  #define PIN_BTN3             17
  #define PIN_BTN4             39
#endif
#ifdef BOARD_C6
  #define PIN_NEOPIXEL         8
  #define PIN_BTN1             3
  #define PIN_BTN2             4
  #define PIN_BTN3             23
  #define PIN_BTN4             15
#endif

#include <FastLED.h>

#define NUM_LEDS    20

CRGB leds[NUM_LEDS];

const uint8_t ERA_1880s[20] = {
  255, 180, 120, 150, 140, 100, 160, 170, 120, 100,
   60,  40,  30,  80,  70,  50,  20,  20,  10,  30
};

const uint8_t ERA_1900[20] = {
  255, 200, 160, 180, 160, 180, 200, 140, 130, 120,
   80,  50,  60,  90,  80,  60,  30,  30,  20,  40
};

const uint8_t ERA_1940[20] = {
  180, 120, 100, 100, 120, 200, 160,  80,  80,  80,
   40,  60, 100, 100,  80,  70,  80,  50,  30,  90
};

const uint8_t ERA_1965[20] = {
  200,  80,  80,  40,  50,  90, 130,  40,  80,  60,
   60, 200, 255, 200, 160, 130, 220, 200, 160, 180
};

CRGB ERA_COLORS[4] = {
  CRGB(200, 120, 50),
  CRGB(220, 80, 80),
  CRGB(80, 150, 220),
  CRGB(80, 220, 100),
};

int currentEra = -1;

void displayEra(const uint8_t* brightness, CRGB color) {
  for (int i = 0; i < NUM_LEDS; i++) {
    leds[i] = color;
    leds[i].nscale8(brightness[i]);
  }
  FastLED.show();
}

void clearMap() {
  fill_solid(leds, NUM_LEDS, CRGB::Black);
  FastLED.show();
}

void setup() {
  Serial.begin(115200);
  FastLED.addLeds<WS2812B, PIN_NEOPIXEL, GRB>(leds, NUM_LEDS);
  FastLED.setBrightness(80);

  pinMode(PIN_BTN1, INPUT_PULLUP);
  pinMode(PIN_BTN2, INPUT_PULLUP);
  pinMode(PIN_BTN3, INPUT_PULLUP);
  pinMode(PIN_BTN4, INPUT_PULLUP);

  clearMap();

  for (int b = 0; b < 60; b += 5) {
    fill_solid(leds, NUM_LEDS, CRGB(b, b/2, 0));
    FastLED.show();
    delay(30);
  }
  Serial.println("Immigration Map Ready");
}

void loop() {
  int newEra = -1;

  if (digitalRead(PIN_BTN1) == LOW) newEra = 0;
  if (digitalRead(PIN_BTN2) == LOW) newEra = 1;
  if (digitalRead(PIN_BTN3) == LOW) newEra = 2;
  if (digitalRead(PIN_BTN4) == LOW) newEra = 3;

  if (newEra >= 0 && newEra != currentEra) {
    currentEra = newEra;
    const uint8_t* data;
    switch (currentEra) {
      case 0: data = ERA_1880s; break;
      case 1: data = ERA_1900; break;
      case 2: data = ERA_1940; break;
      case 3: data = ERA_1965; break;
    }
    displayEra(data, ERA_COLORS[currentEra]);

    Serial.print("Showing era: ");
    Serial.println(currentEra);
    delay(300);
  }
}
Line-by-line: what every line does and why
Lines 1–5: Setup basics
#include <FastLED.h>
#define PIN_NEOPIXEL         2
#define NUM_LEDS    20
CRGB leds[NUM_LEDS];
#include <FastLED.h> grabs the LED control instruction book. PIN_NEOPIXEL 2 (C6: 8) and NUM_LEDS 20 are sticky-note names for the data wire leg and LED count. CRGB leds[20] creates a shelf with 20 compartments — one color slot per city LED.
Lines 7–10: Button pins
#define PIN_BTN1             15
#define PIN_BTN2             16
#define PIN_BTN3             17
#define PIN_BTN4             39
#define gives each button pin a name that never changes. Each button is wired to one leg of the ESP32. PIN_BTN1 (leg 15, C6: leg 3) = 1880s era, PIN_BTN2 (leg 16, C6: leg 4) = 1900–1920, and so on.
Lines 12–31: The historical data arrays
const uint8_t ERA_1880s[20] = {
  255, 180, 120, 150, ...
};
This is the most important part of the whole project. uint8_t is a number from 0 to 255 — an 8-bit brightness value. ERA_1880s[20] is an array of 20 brightness numbers, one per city. The order matches the city list from Step 0: position 0 = New York, position 1 = Boston, and so on.
255 means full brightness — that city was a dominant immigration destination. 10 means nearly dark — barely any immigration there in that era. These numbers came from historical census data. You encoded history as light intensity.
Lines 33–38: Era colors
CRGB ERA_COLORS[4] = {
  CRGB(200, 120, 50),
  CRGB(220, 80, 80),
  CRGB(80, 150, 220),
  CRGB(80, 220, 100),
};
Each era has its own color. CRGB(red, green, blue) where each value is 0–255. Amber/gold for the 1880s, red for peak Ellis Island, blue for wartime displacement, green for the new post-1965 era. The color is then dimmed per city by the brightness data.
Lines 40–47: displayEra() — the data visualization function
void displayEra(const uint8_t* brightness, CRGB color) {
  for (int i = 0; i < NUM_LEDS; i++) {
    leds[i] = color;
    leds[i].nscale8(brightness[i]);
  }
  FastLED.show();
}
const uint8_t* brightness is a pointer — instead of copying the whole array, we pass its address. Think of it like giving someone the address of a library book instead of photocopying the whole thing. The for loop runs once per city. leds[i] = color sets every city to the era’s base color. leds[i].nscale8(brightness[i]) then dims each LED by its historical value — 255 keeps full brightness, 0 turns the LED off completely, 128 halves the brightness. This one function turns historical data into a visual map.
Lines 49–73: setup() — morning routine
FastLED.addLeds<WS2812B, PIN_NEOPIXEL, GRB>(leds, NUM_LEDS);
FastLED.setBrightness(80);
Tell FastLED: WS2812B LEDs, data on leg 2 (C6: leg 8), GRB color order, 20 total. Set global brightness to 80/255.
pinMode(PIN_BTN1, INPUT_PULLUP);Four times, once per button. INPUT_PULLUP means the pin reads HIGH normally (button not pressed) and LOW when the button is pressed (connects the pin to GND). This is why we check digitalRead(PIN_BTN1) == LOW later instead of == HIGH.
for (int b = 0; b < 60; b += 5) {
  fill_solid(leds, NUM_LEDS, CRGB(b, b/2, 0));
  FastLED.show();
  delay(30);
}
A startup animation: b goes from 0 to 55 in steps of 5. CRGB(b, b/2, 0) creates a warm amber that gets brighter with each step — like cities slowly lighting up at dusk. FastLED.show() + delay(30) creates a smooth fade-in over about 360ms.
Lines 75–99: loop() — button detection
int newEra = -1;
if (digitalRead(PIN_BTN1) == LOW) newEra = 0;
if (digitalRead(PIN_BTN2) == LOW) newEra = 1;
if (digitalRead(PIN_BTN3) == LOW) newEra = 2;
if (digitalRead(PIN_BTN4) == LOW) newEra = 3;
newEra starts at -1 (“no button pressed”). Each if checks one button. If pressed (LOW), it sets newEra to the era number 0–3.
if (newEra >= 0 && newEra != currentEra) {
  currentEra = newEra;
  const uint8_t* data;
  switch (currentEra) {
    case 0: data = ERA_1880s; break;
    case 1: data = ERA_1900; break;
    ...
  }
  displayEra(data, ERA_COLORS[currentEra]);
  delay(300);
}
newEra >= 0 means a button was pressed. newEra != currentEra means it is a different era than what is already showing — no need to redraw the same thing. switch is a more efficient way to write multiple if/else checks — it jumps directly to the matching case. data is set to point at the matching brightness array. displayEra() updates all 20 LEDs. delay(300) is debouncing — it prevents the button from registering 10 times from a single press (your finger takes about 300ms to lift off).
The whole thing in one sentence
On power-on, set up the LEDs and buttons, then fade all city lights up from black (setup). Then forever, check the four buttons — if a new era button is pressed, load that era’s brightness data and redraw all 20 city LEDs (loop).
First thing to try: Upload the code, press Button 1 (1880s). New York and Chicago should be the brightest cities. Then press Button 4 (1965+). Watch the light shift south and west — Miami, San Antonio, Los Angeles should now dominate. That geographic shift is 80 years of immigration policy encoded as LED brightness.
Check: Upload and press each button. The LEDs should light up in different patterns based on the era’s data. Era 1 (Ellis Island) should be brightest in the Northeast. Era 4 (1965+) should shift to the South and West.
Step 3: Add era labels to the map
Time: ~20 minutes
Print four labels on card stock and attach them near the buttons:
- Button 1 — 1880–1900: “First Great Wave — Southern & Eastern Europe. ~9 million immigrants. Ellis Island opens 1892.”
- Button 2 — 1900–1924: “Peak Ellis Island — Italian, Jewish, Polish. 1924 Immigration Act restricts flow.”
- Button 3 — 1940–1965: “WWII Displaced Persons, Puerto Rico, Korean War refugees. Bracero Program.”
- Button 4 — 1965–present: “Hart-Celler Act ends national origin quotas. Latin American + Asian immigration surge.”
Step 4: Present it!
Presentation tip: Start with all LEDs off. Say: “Before I show you the data, what’s your hypothesis — where did most immigrants settle?” Let the audience answer. Then press Button 1. Watch their eyes go to New York and Chicago. Then press Button 4. Watch their eyes shift west and south.
Say: “The geographic shift between these two maps reflects two things: the change in immigration law in 1965, and the shift in US economic opportunity from Rust Belt manufacturing to Sun Belt service industries. The data encoded in these LEDs comes from Census Bureau immigration records.”
What just happened
You encoded historical data as light intensity — a form of data visualization. The nscale8() function scales color by an 8-bit brightness value (0–255), which maps to your relative immigration data. This is the same technique cartographers use in choropleth maps (those maps where darker colors = higher values).
You also used data-driven design — the lights are determined by numbers from research, not arbitrary choices. Change the brightness arrays, and the map changes.
Curriculum connections:
- Common Core History RH.9-10.9: Compare and contrast treatments of the same topic in several primary and secondary sources
- NGSS Science Practice 4: Analyzing and interpreting data
- Common Core Math 6.SP: Summarize and describe distributions; display numerical data in graphs
Level Up
Animated transition: When switching eras, fade between the two data sets over 2 seconds. Show the geographic shift as a smooth animation.
Fifth button — compare mode: Press two buttons simultaneously. Show Era 1 in red LEDs and Era 4 in green LEDs simultaneously — overlapping cities show orange (yellow mix).
Add real numbers: Print actual census numbers next to each city dot: “NYC 1900: 1.2M immigrants.” When you press a button, those specific numbers illuminate.
Troubleshooting
| Problem | Fix |
|---|---|
| LEDs don’t change when button pressed | Check INPUT_PULLUP is set. Button should connect GPIO to GND (not 5V). |
| Random LEDs light up on button press | Debounce issue — increase the delay(300) at bottom of loop. |
| Wrong colors | Change GRB to RGB in FastLED.addLeds line. |
| Only some LEDs work | Check for a break in the strip. Reconnect with a jumper wire. |
| Upload fails | Hold BOOT button on ESP32 while clicking Upload. |