Parent info
Parts you need
Affiliate links — we may earn a small commission
Try this circuit in your browser!
Run the code, press the buttons and watch what happens — before you buy any parts. No account needed.
Open in Simulator →Your classmates stopped at the color change. You found the equivalence point to 0.01 pH.
Imagine this: AP Chemistry titration lab. Everyone watches for the phenolphthalein indicator to turn pink — that’s the endpoint. You write down “about 12.4mL of NaOH.” Approximate. Color-dependent.
Your titration is different. You drop in a pH sensor. As you add NaOH drop by drop, your OLED plots the pH curve in real time. You see the S-curve forming. You detect the inflection point automatically — the steepest rise. The display reads: “Equivalence point: 7.02 pH at 12.4mL.”
You don’t need an indicator. You have data.
That’s what we’re building. For about $28.
What you’ll need
| Part | What it does | Price |
|---|---|---|
| ESP32-S3-DevKitC-1 | Brain — reads pH, graphs curve, detects equivalence point | ~$12 |
| pH sensor module + probe | Measures pH 0–14 with analog output | ~$10 |
| OLED display 0.96” | Real-time titration curve | ~$4 |
| Breadboard + jumper wires | Wires everything | ~$5 |
You also need: burette (or syringe for controlled addition), titrant solution (NaOH, HCl, etc.), analyte solution, stir plate or stir rod, pH buffer solutions (4.0, 7.0, 10.0 for calibration).
Total: ~$28 | Time: ~3 hours | Difficulty: ●●●●○
How it works (60 seconds)
A pH sensor is a glass electrode that generates a voltage proportional to the hydrogen ion concentration in solution. At pH 7 (neutral), it outputs a reference voltage. Acids (low pH) shift the voltage in one direction; bases (high pH) shift it the other way.
The sensor module converts this voltage to an analog signal (0–5V, scaled to 0–3.3V with a divider) that the ESP32 reads on its ADC. Calibration with known pH buffer solutions converts ADC readings to actual pH units.
The titration curve is an S-curve — pH changes slowly far from equivalence point, then dramatically at the equivalence point (the inflection). The steepest point of the curve is the equivalence point. The code detects this automatically by finding the maximum rate of pH change (first derivative peak).
Step 0: Plan your titration
Common school titrations:
- Strong acid + strong base: HCl + NaOH → NaCl + H₂O. Equivalence at pH 7.
- Weak acid + strong base: Acetic acid (vinegar) + NaOH. Equivalence above pH 7.
- Household acid: Vinegar, lemon juice, or vitamin C solution + NaOH solution.
Prepare your solutions:
- Titrant (in burette): 0.1M NaOH solution
- Analyte (in beaker): 25mL of 0.1M HCl or 25mL of white vinegar
Goal: Add NaOH in small increments (0.5mL at a time) and record pH after each addition. This gives you ~25 data points to plot the full S-curve.
Step 1: Wire it up
Time: ~15 minutes
pH sensor modules typically have 3 pins:
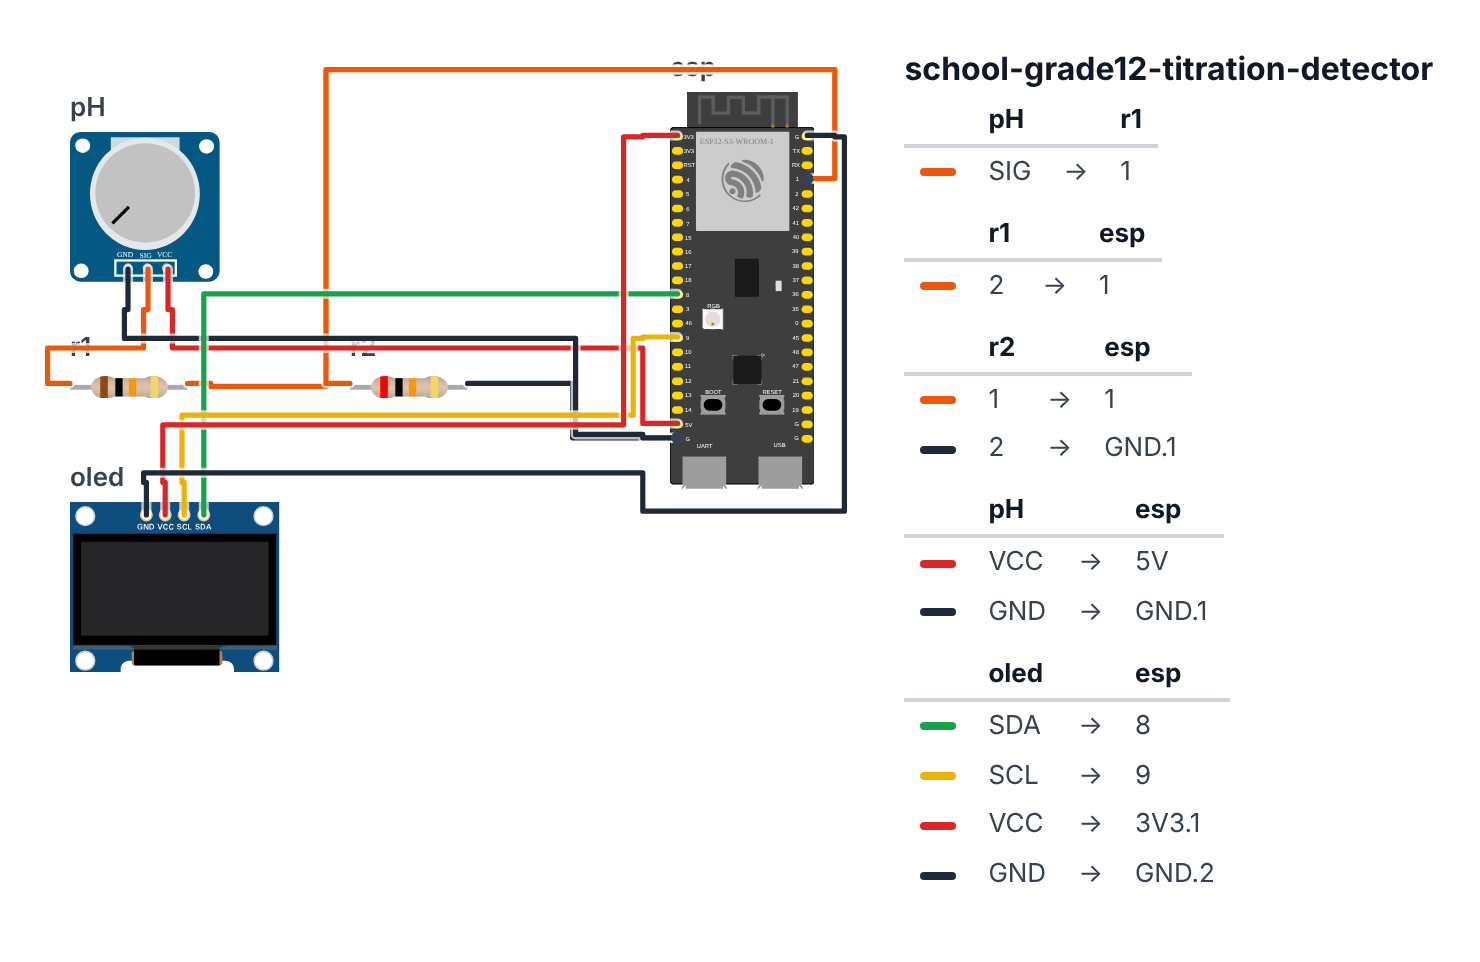
pH Module → ESP32:
- Signal (V0) → board GPIO 1 (C6: GPIO 4) (via voltage divider if module outputs 5V)
- VCC (5V) → 5V
- GND → GND
Important: Most pH modules output 0–5V. The ESP32 ADC accepts 0–3.3V. You MUST use a voltage divider (10kΩ + 20kΩ) or a level-shifting module between the pH signal and GPIO 1 (C6: GPIO 4). Connecting 5V directly to that pin may damage the ESP32.
Voltage divider for pH signal:
- pH signal → 10kΩ → GPIO 1 (C6: GPIO 4)
- GPIO 1 (C6: GPIO 4) → 20kΩ → GND
- This scales: Vout = Vin × (20/(10+20)) = Vin × 0.667
OLED: 4. SDA → board GPIO 8 (C6: GPIO 6) 5. SCL → board GPIO 9 (C6: GPIO 7) 6. VCC → 3.3V 7. GND → GND
Step 2: Flash the code
Time: ~25 minutes
Install: Adafruit SSD1306, Adafruit GFX Library
The big picture first. This program turns the ESP32 into a digital titration detector:
- The pH sensor outputs a voltage that changes with acidity. The ESP32’s ADC reads that voltage as a number (0–4095) and converts it to pH using two calibration constants.
- You add NaOH in small steps. After each addition, press the BOOT button — the program reads the current pH, saves it alongside the volume added, and adds a new point to the curve.
findEquivalencePoint()scans through all your data points and finds where the pH changed fastest — the steepest part of the S-curve. It draws a circle at that point.- The X axis is volume added (mL), the Y axis is pH (0–14). As points accumulate, the S-curve builds up in real time.
IMPORTANT: Calibrate the sensor with pH buffer solutions (Step 3) before running your actual titration. A program is like a recipe. Copy this entire recipe into Arduino IDE and upload it:
// ========== CHOOSE YOUR BOARD ==========
// Uncomment the line for YOUR board:
#define BOARD_S3    // ESP32-S3-DevKitC-1
//#define BOARD_C6  // ESP32-C6-DevKitC-1
// ========================================

#ifdef BOARD_S3
  #define PIN_SDA      8
  #define PIN_SCL      9
  #define PIN_PH       1
  #define PIN_BUTTON   0
#endif
#ifdef BOARD_C6
  #define PIN_SDA      6
  #define PIN_SCL      7
  #define PIN_PH       4
  #define PIN_BUTTON   9
#endif

#include <Wire.h>
#include <Adafruit_GFX.h>
#include <Adafruit_SSD1306.h>
#include <math.h>

Adafruit_SSD1306 display(128, 64, &Wire, -1);

#define PH_PIN PIN_PH

float pH_slope = -0.0178;
float pH_offset = 21.34;

float pHLog[100];
float volumeLog[100];
int dataCount = 0;
float addedVolume = 0;
float stepSize = 0.5;

int equivIdx = -1;

float readPH() {
  long sum = 0;
  for (int i = 0; i < 30; i++) {
    sum += analogRead(PH_PIN);
    delay(10);
  }
  int adcAvg = sum / 30;
  float ph = pH_slope * adcAvg + pH_offset;
  return constrain(ph, 0.0, 14.0);
}

int findEquivalencePoint() {
  if (dataCount < 3) return -1;

  float maxSlope = 0;
  int maxIdx = 0;

  for (int i = 1; i < dataCount - 1; i++) {
    float dph = pHLog[i+1] - pHLog[i-1];
    float dvol = volumeLog[i+1] - volumeLog[i-1];
    float slope = (dvol > 0) ? abs(dph / dvol) : 0;
    if (slope > maxSlope) {
      maxSlope = slope;
      maxIdx = i;
    }
  }
  return maxIdx;
}

void drawGraph() {
  display.clearDisplay();

  if (dataCount < 2) {
    display.setTextSize(1);
    display.setCursor(0, 0);
    display.println("Titration Curve");
    display.setCursor(0, 20);
    display.println("pH: " + String(readPH(), 2));
    display.setCursor(0, 36);
    display.println("Press BOOT after");
    display.setCursor(0, 48);
    display.println("each addition");
    display.display();
    return;
  }

  float maxVol = volumeLog[dataCount-1];

  display.drawFastVLine(10, 0, 54, SSD1306_WHITE);
  display.drawFastHLine(10, 54, 118, SSD1306_WHITE);

  for (int i = 0; i < dataCount; i++) {
    int x = map(i, 0, max(dataCount-1, 1), 12, 126);
    int y = map((int)(pHLog[i] * 10), 0, 140, 52, 2);
    display.drawPixel(x, y, SSD1306_WHITE);
    if (i > 0) {
      int prevX = map(i-1, 0, max(dataCount-1, 1), 12, 126);
      int prevY = map((int)(pHLog[i-1] * 10), 0, 140, 52, 2);
      display.drawLine(prevX, prevY, x, y, SSD1306_WHITE);
    }
  }

  equivIdx = findEquivalencePoint();
  if (equivIdx >= 0) {
    int ex = map(equivIdx, 0, max(dataCount-1, 1), 12, 126);
    int ey = map((int)(pHLog[equivIdx] * 10), 0, 140, 52, 2);
    display.drawCircle(ex, ey, 3, SSD1306_WHITE);
  }

  display.setTextSize(1);
  display.setCursor(0, 0);
  display.println("pH");
  display.setCursor(60, 56);
  display.println("mL");

  float curPH = readPH();
  display.setCursor(70, 0);
  display.println("pH:" + String(curPH, 2));

  if (equivIdx >= 0) {
    display.setCursor(0, 55);
    display.println("Eq: " + String(pHLog[equivIdx], 1) + "pH@" + String(volumeLog[equivIdx], 1) + "mL");
  }

  display.display();
}

void setup() {
  Serial.begin(115200);
  Wire.begin(PIN_SDA, PIN_SCL);
  display.begin(SSD1306_SWITCHCAPVCC, 0x3C);
  pinMode(PIN_BUTTON, INPUT_PULLUP);

  display.clearDisplay();
  display.setTextSize(1);
  display.setCursor(5, 10);
  display.println("Titration Detector");
  display.setCursor(5, 25);
  display.println("Calibrate first!");
  display.setCursor(5, 40);
  display.println("See Step 3.");
  display.display();
  delay(3000);

  Serial.println("volume_mL,pH");
}

unsigned long lastBtn = 0;

void loop() {
  drawGraph();

  if (digitalRead(PIN_BUTTON) == LOW && millis() - lastBtn > 500) {
    lastBtn = millis();
    float ph = readPH();

    pHLog[dataCount] = ph;
    volumeLog[dataCount] = addedVolume;
    dataCount++;
    addedVolume += stepSize;

    Serial.println(String(addedVolume - stepSize, 1) + "," + String(ph, 3));

    if (dataCount >= 100) dataCount = 99;
    delay(200);
  }
}
Line-by-line: what every line does and why
Lines 1–4: Borrowing ready-made tools
#include <Wire.h>
#include <Adafruit_GFX.h>
#include <Adafruit_SSD1306.h>
#include <math.h>
#include means “grab this instruction book.” math.h provides abs() for calculating absolute values in the equivalence point detection.
Lines 8–10: pH calibration constants
float pH_slope = -0.0178;
float pH_offset = 21.34;
These two numbers are your personal calibration for your specific sensor and voltage divider. pH_slope is negative because higher ADC readings (higher voltage from the sensor) correspond to lower pH (more acidic). pH_offset shifts the whole scale. The formula ph = pH_slope * adcAvg + pH_offset is a straight line — this is called a linear calibration. You determine your own values in Step 3.
Lines 12–16: Data storage
float pHLog[100];
float volumeLog[100];
int dataCount = 0;
float addedVolume = 0;
float stepSize = 0.5;
Two parallel shelves with 100 slots each — one for pH readings, one for corresponding volumes. They stay synchronized: pHLog[3] and volumeLog[3] are from the same button press. addedVolume starts at 0 and increases by stepSize (0.5mL) every time BOOT is pressed. This assumes you add exactly 0.5mL per step — be precise with your burette.
Lines 20–29: readPH() — averaging for stability
float readPH() {
  long sum = 0;
  for (int i = 0; i < 30; i++) {
    sum += analogRead(PH_PIN);
    delay(10);
  }
  int adcAvg = sum / 30;
  float ph = pH_slope * adcAvg + pH_offset;
  return constrain(ph, 0.0, 14.0);
}
Reading 30 times over 300ms (30 × 10ms) and averaging removes electrical noise. The pH probe is analog — a tiny voltage that varies slightly from moment to moment. A single reading might be off. The average of 30 is much more stable.
constrain(ph, 0.0, 14.0) clips the result to the valid pH scale. If calibration is slightly off and gives pH 14.5, constrain clamps it to 14.0 rather than letting impossible values confuse your graph.
Lines 31–45: findEquivalencePoint() — calculus applied to data
int findEquivalencePoint() {
  if (dataCount < 3) return -1;

  for (int i = 1; i < dataCount - 1; i++) {
    float dph = pHLog[i+1] - pHLog[i-1];
    float dvol = volumeLog[i+1] - volumeLog[i-1];
    float slope = (dvol > 0) ? abs(dph / dvol) : 0;
    if (slope > maxSlope) {
      maxSlope = slope;
      maxIdx = i;
    }
  }
  return maxIdx;
}
This function finds the inflection point — where the S-curve is steepest. For each data point i, it looks at the point before (i-1) and after (i+1) and calculates how much pH changed per mL added: dph / dvol. This is the numerical derivative of the titration curve.
The point where this derivative is maximum (the steepest slope) is the equivalence point. if (slope > maxSlope) keeps updating maxIdx whenever a steeper point is found. At the end, maxIdx holds the index of the equivalence point.
if (dataCount < 3) return -1 — need at least 3 points to have a “before” and “after.” -1 is the code’s way of saying “no result yet.”
Lines 47–100: drawGraph() — building the titration curve
if (dataCount < 2) {
  display.println("pH: " + String(readPH(), 2));
  display.println("Press BOOT after each addition");
  display.display();
  return;
}
Before two points exist, there’s no curve to draw. Show the live pH reading and instructions instead. return exits the function early.
display.drawFastVLine(10, 0, 54, SSD1306_WHITE);
display.drawFastHLine(10, 54, 118, SSD1306_WHITE);
Draw the axes: a vertical line for pH (Y axis) and a horizontal line for volume (X axis). The axes meet at (10, 54) — the bottom-left corner of the plot area.
int x = map(i, 0, max(dataCount-1, 1), 12, 126);
int y = map((int)(pHLog[i] * 10), 0, 140, 52, 2);
map() converts data to pixel coordinates. The X axis spreads all data points evenly across 12–126 pixels (the plot width). The Y axis maps pH 0–14 (stored × 10 as 0–140) to pixel rows 52 (bottom) to 2 (top). Higher pH = higher on screen = lower pixel number.
display.drawLine(prevX, prevY, x, y, SSD1306_WHITE);Connect each point to the previous one with a line — this is what makes it a curve rather than isolated dots.
Lines 102–120: setup() and loop() — BOOT button logging
if (digitalRead(PIN_BUTTON) == LOW && millis() - lastBtn > 500) {
  lastBtn = millis();
  float ph = readPH();

  pHLog[dataCount] = ph;
  volumeLog[dataCount] = addedVolume;
  dataCount++;
  addedVolume += stepSize;

  Serial.println(String(addedVolume - stepSize, 1) + "," + String(ph, 3));
}
digitalRead(PIN_BUTTON) == LOW detects the BOOT button (pin 0, C6: pin 9, goes LOW when pressed). millis() - lastBtn > 500 prevents logging twice from one press. After logging: save pH, save the current volume, increment dataCount, add 0.5mL to addedVolume. Print to Serial in CSV format for your spreadsheet.
The whole thing in one sentence
The device shows live pH on screen. Each BOOT press logs a data point, advances the volume counter, and redraws the titration curve — the circle marking the equivalence point appears automatically once enough data is logged.
First thing to try: before starting the real experiment, test the BOOT button by pressing it 5 times without any cell connected. Five points should appear on the display at whatever pH the sensor happens to read. This confirms the logging and graphing work before your chemistry setup is in place.
Step 3: Calibrate your pH sensor
Time: ~20 minutes — DO THIS BEFORE YOUR EXPERIMENT
The default slope and offset values are estimates. For accurate results:
- Rinse probe in distilled water
- Place probe in pH 7.0 buffer solution. Read raw ADC value:
analogRead(PH_PIN)— add aSerial.println(analogRead(PH_PIN))temporarily - Note value A7 (at pH 7)
- Place probe in pH 4.0 buffer. Note value A4.
- Calculate:
pH_slope = (7.0 - 4.0) / (A7 - A4) - Calculate:
pH_offset = 7.0 - pH_slope * A7 - Update these in the code and re-upload
Verify with pH 10 buffer — should read within ±0.2 pH.
Step 4: Run the titration!
Protocol:
- Start probe in analyte (25mL of your acid solution). Press BOOT to log starting pH.
- Add 0.5mL of titrant (NaOH). Stir. Wait 15 seconds.
- Press BOOT to log.
- Repeat until well past the equivalence point (pH > 11).
The S-curve should appear on the OLED as you add more titrant. The circle marks the detected equivalence point.
Presentation tip: Run the titration live. Add NaOH drop by drop near the equivalence point — the pH jumps dramatically. Say: “This is the equivalence point — the moles of acid equal the moles of base. The sensor detected it at pH [X] after adding [Y] mL. The theoretical equivalence point for this acid-base pair is pH [Z] — my measurement is off by [percent].”
What just happened
You detected an inflection point numerically — finding where the second derivative changes sign (or equivalently, where the first derivative is maximum). This is calculus applied to experimental data. The same algorithm is used in stock price analysis (finding trend reversals) and signal processing (finding peaks).
The pH electrode uses the Nernst Equation: E = E₀ + (RT/nF)ln[H⁺], relating electrode potential to hydrogen ion activity. The ~59mV/pH slope at room temperature is a fundamental electrochemical constant.
Curriculum connections:
- AP Chemistry: Acid-base equilibria, titration curves, Henderson-Hasselbalch equation, equivalence point
- AP Calculus: Derivatives, inflection points, optimization
- NGSS HS-PS1-7: Use mathematical representations to support the claim that atoms, and therefore mass, are conserved during a chemical reaction
A titration detecting the equivalence point automatically (like yours does) is standard in pharmaceutical manufacturing and water quality testing. Your device replicates the core function of instruments costing thousands of dollars.
Level Up
Polyprotic acid: Titrate phosphoric acid (H₃PO₄) — it has three equivalence points. Plot the full curve and identify all three inflection points.
Concentration calculation: From the equivalence point volume, calculate the exact concentration of your unknown acid. Compare to the nominal concentration on the bottle.
Buffer region identification: On your titration curve, mark the buffer region (the flat part before the equivalence point). Calculate the buffer capacity (resistance to pH change per mL added).
Troubleshooting
| Problem | Fix |
|---|---|
| pH reads constant (no change) | Probe needs conditioning — soak in pH 4 buffer for 30 min. Check voltage divider. |
| pH jumps wildly | Mix solution more thoroughly before reading. Increase averaging (more samples in readPH()). |
| Calibration gives wrong results | Use fresh, certified buffer solutions. Rinse probe with distilled water between buffers. |
| Equivalence point not detected | Need at least 5+ readings across the transition. Add smaller volumes near pH 7. |
| Upload fails | Hold BOOT button while clicking Upload. |