Parent info
Parts you need
Affiliate links — we may earn a small commission
Try this circuit in your browser!
Run the code, press the buttons and watch what happens — before you buy any parts. No account needed.
Open in Simulator →Your classmates cited statistics. Yours animate in real time.
Imagine this: AP US History research project on the Great Depression. Everyone writes “unemployment reached 24.9% in 1933” in their paper. It’s just a number.
Your device is different. You press a button and the OLED shows 1929: unemployment bar at 3.2%. Press again: 1930, bar grows. 1931: bigger. 1932: bigger. 1933: the bar maxes out at 24.9% with a stark label: “1 in 4 Americans unemployed.” Press again: 1934, 1935 — the New Deal kicks in, the bar starts dropping. By 1939 it’s still at 14.6% — you can see the Depression never fully ended before WWII.
That’s not statistics. That’s history you can watch.
That’s what we’re building. For about $25.
What you’ll need
| Part | What it does | Price |
|---|---|---|
| ESP32-S3-DevKitC-1 | Brain — stores the data, runs animations | ~$12 |
| OLED display 0.96” | 128×64 pixel display for animated charts | ~$4 |
| Push buttons ×2 | Advance forward/backward through years | ~$3 |
| Breadboard + jumper wires | Wires it all | ~$5 |
You also need: home WiFi (for optional web dashboard), button labels.
Total: ~$25 | Time: ~2 hours | Difficulty: ●●●○○
How it works (60 seconds)
You’re building a data visualization device — a display that encodes historical numbers as visual forms (bar charts, graphs). The data is embedded directly in the code as arrays.
Each button press advances or retreats one year. The OLED redraws with the new year’s data — unemployment rate, GDP, Dow Jones, bank failures. The bars animate from the previous value to the new one, making the change feel dramatic rather than just a number on a page.
Step 0: Research your data
Time: ~30 minutes
This is the history work — make sure your data is accurate. Key datasets (from Federal Reserve history, Bureau of Labor Statistics):
| Year | Unemploy% | GDP Change% | Dow Jones | Bank Failures | Key Event |
|---|---|---|---|---|---|
| 1929 | 3.2 | +6.7 | 381 | 659 | Stock Market Crash Oct |
| 1930 | 8.7 | -8.5 | 165 | 1352 | Hawley-Smoot Tariff |
| 1931 | 15.9 | -6.4 | 77 | 2294 | Bank Panic, Britain off gold |
| 1932 | 23.6 | -13.0 | 41 | 1456 | Hoover’s austerity |
| 1933 | 24.9 | -1.3 | 66 | 4000 | FDR inaugurated, Bank Holiday |
| 1934 | 21.7 | +10.8 | 93 | 52 | FDIC established, AAA |
| 1935 | 20.1 | +8.9 | 119 | 32 | Social Security Act |
| 1936 | 16.9 | +12.9 | 184 | 44 | FDR re-elected |
| 1937 | 14.3 | +5.1 | 179 | 59 | FDR cuts spending, recession |
| 1938 | 19.0 | -3.4 | 121 | 54 | “Roosevelt Recession” |
| 1939 | 14.6 | +8.0 | 131 | 60 | War spending begins |
You don’t need all datasets — unemployment + one or two others is enough for a strong presentation.
Step 1: Wire it up
Time: ~10 minutes
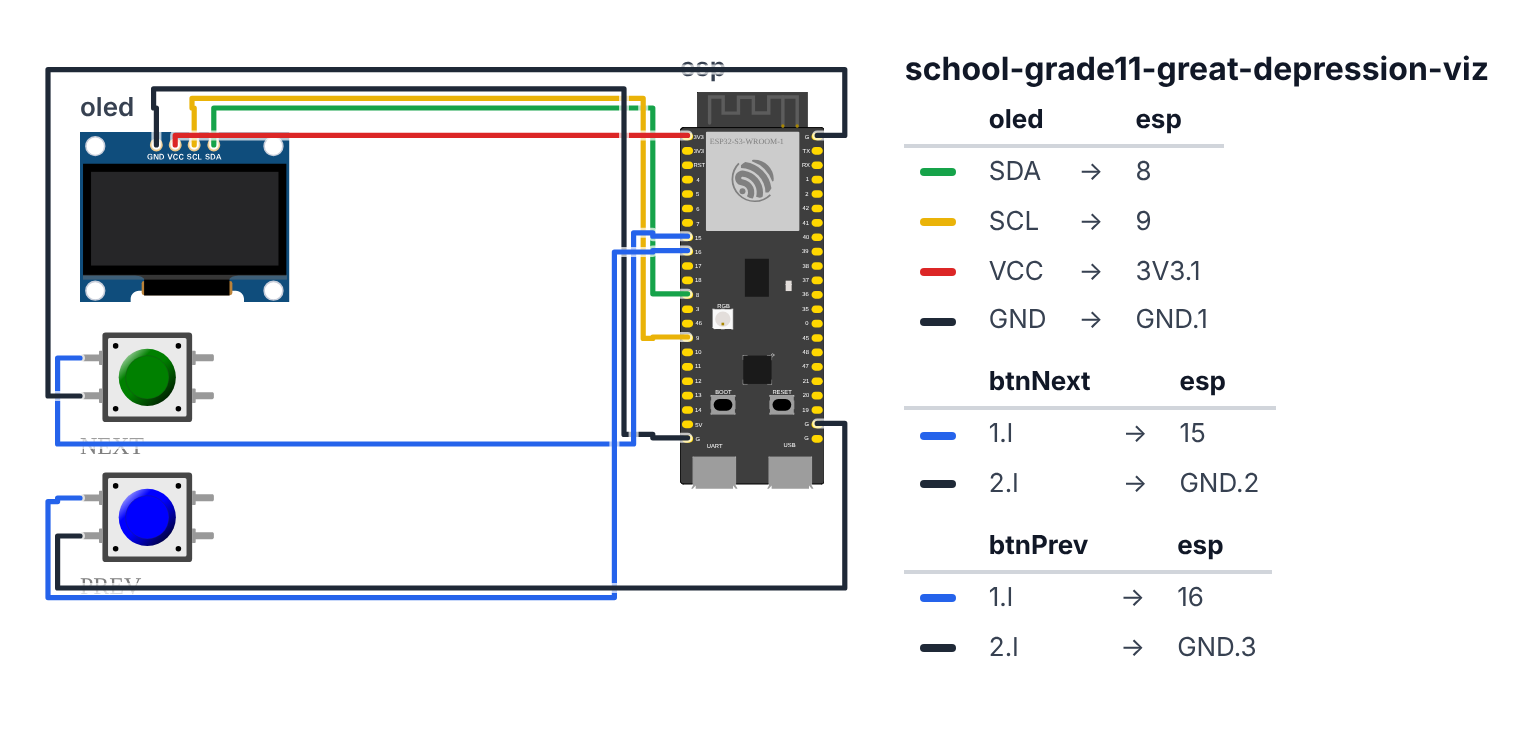
OLED:
- SDA → board GPIO 8 (C6: GPIO 6)
- SCL → board GPIO 9 (C6: GPIO 7)
- VCC → 3.3V
- GND → GND
Buttons: 5. Button NEXT → board GPIO 15 (C6: GPIO 3) (year forward) 6. Button PREV → board GPIO 16 (C6: GPIO 4) (year backward)
Both buttons: one leg to GPIO, other leg to GND. Use INPUT_PULLUP.
Step 2: Flash the code
Time: ~20 minutes
Install: Adafruit SSD1306, Adafruit GFX Library
The big picture first. This program turns the ESP32 into a portable history dashboard:
- All 11 years of Depression data are stored as arrays of numbers directly in the code — no internet needed.
- Two buttons let you step forward and backward through the years.
- When you press a button, the unemployment bar animates from the old value to the new one, making the change feel dramatic.
- The
map()function converts data numbers into pixel positions so the bar fits on the tiny screen.
A program is like a recipe. Copy this entire recipe into Arduino IDE and upload it:
// ========== CHOOSE YOUR BOARD ==========
// Uncomment the line for YOUR board:
#define BOARD_S3    // ESP32-S3-DevKitC-1
//#define BOARD_C6  // ESP32-C6-DevKitC-1
// ========================================

#ifdef BOARD_S3
  #define PIN_SDA       8
  #define PIN_SCL       9
  #define PIN_BTN_NEXT  15
  #define PIN_BTN_PREV  16
#endif
#ifdef BOARD_C6
  #define PIN_SDA       6
  #define PIN_SCL       7
  #define PIN_BTN_NEXT  3
  #define PIN_BTN_PREV  4
#endif

#include <Wire.h>
#include <Adafruit_GFX.h>
#include <Adafruit_SSD1306.h>

Adafruit_SSD1306 display(128, 64, &Wire, -1);

#define BTN_NEXT PIN_BTN_NEXT
#define BTN_PREV PIN_BTN_PREV

const int NUM_YEARS = 11;
const int START_YEAR = 1929;

const int unemployment[NUM_YEARS]  = {32, 87, 159, 236, 249, 217, 201, 169, 143, 190, 146};
const int gdpChange[NUM_YEARS]     = {67, -85, -64, -130, -13, 108, 89, 129, 51, -34, 80};
const int dowJones[NUM_YEARS]      = {381, 165, 77, 41, 66, 93, 119, 184, 179, 121, 131};

const char* events[NUM_YEARS] = {
  "Stock Crash!",
  "Smoot-Hawley",
  "Bank Panics",
  "Hoover cuts",
  "FDR Day 1",
  "FDIC+AAA",
  "Soc.Security",
  "FDR wins big",
  "FDR cuts again",
  "Roosevelt Rec.",
  "War spending"
};

int currentYear = 0;
float displayedUnemployment = 0;

void animateToYear(int yr) {
  float targetUnemp = unemployment[yr] / 10.0;
  float step = (targetUnemp - displayedUnemployment) / 20.0;

  for (int f = 0; f < 20; f++) {
    displayedUnemployment += step;
    drawScreen(yr, displayedUnemployment);
    delay(30);
  }
  displayedUnemployment = targetUnemp;
}

void drawScreen(int yr, float unemp) {
  display.clearDisplay();

  display.setTextSize(2);
  display.setCursor(0, 0);
  display.println(String(START_YEAR + yr));

  display.setTextSize(1);
  display.setCursor(72, 0);
  display.println(String(unemp, 1) + "%");
  display.setCursor(72, 10);
  display.println("unemp.");

  int barLen = map((int)(unemp * 10), 0, 300, 0, 120);
  display.drawRect(0, 20, 128, 12, SSD1306_WHITE);
  display.fillRect(0, 20, barLen, 12, SSD1306_WHITE);

  if (unemp >= 20.0) {
    display.setCursor(0, 20);
    display.setTextColor(SSD1306_BLACK, SSD1306_WHITE);
    display.print("  CRISIS  ");
    display.setTextColor(SSD1306_WHITE, SSD1306_BLACK);
  }

  display.setCursor(0, 36);
  int gdp = gdpChange[yr];
  display.print("GDP: ");
  if (gdp >= 0) display.print("+");
  display.println(String(gdp / 10.0, 1) + "%");

  display.setCursor(0, 46);
  display.println("Dow: " + String(dowJones[yr]));

  display.setCursor(70, 36);
  display.println(events[yr]);

  display.setCursor(0, 56);
  display.println("< PREV  NEXT >");

  display.display();
}

void setup() {
  Serial.begin(115200);
  Wire.begin(PIN_SDA, PIN_SCL);
  display.begin(SSD1306_SWITCHCAPVCC, 0x3C);

  pinMode(BTN_NEXT, INPUT_PULLUP);
  pinMode(BTN_PREV, INPUT_PULLUP);

  display.clearDisplay();
  display.setTextSize(1);
  display.setCursor(10, 20);
  display.println("The Great Depression");
  display.setCursor(20, 36);
  display.println("1929 - 1939");
  display.display();
  delay(2000);

  displayedUnemployment = unemployment[0] / 10.0;
  drawScreen(0, displayedUnemployment);
}

unsigned long lastBtn = 0;

void loop() {
  if (millis() - lastBtn < 400) return;

  if (digitalRead(BTN_NEXT) == LOW) {
    lastBtn = millis();
    currentYear = min(currentYear + 1, NUM_YEARS - 1);
    animateToYear(currentYear);
  }

  if (digitalRead(BTN_PREV) == LOW) {
    lastBtn = millis();
    currentYear = max(currentYear - 1, 0);
    animateToYear(currentYear);
  }
}
Line-by-line: what every line does and why
Lines 1–3: Borrowing ready-made tools
#include <Wire.h>
#include <Adafruit_GFX.h>
#include <Adafruit_SSD1306.h>
#include means “grab this instruction book.” These three books teach the ESP32 how to use two-wire I2C communication, how to draw shapes and text, and how to control the OLED screen specifically. We borrow them so we don’t have to write those instructions ourselves.
Lines 5–6: Button pins
#define BTN_NEXT PIN_BTN_NEXT
#define BTN_PREV PIN_BTN_PREV
#define gives a pin a nickname. Pin 15 (C6: pin 3) is called BTN_NEXT and pin 16 (C6: pin 4) is called BTN_PREV. This way, if you ever need to change which pin a button is connected to, you change it in one place instead of hunting through the whole code.
Lines 8–9: Dataset size
const int NUM_YEARS = 11;
const int START_YEAR = 1929;
const means “this number never changes.” int means it is a whole number (no decimal point). We have 11 years of data (1929 through 1939). START_YEAR lets us calculate 1929 + yr instead of typing out every year.
Lines 11–13: The historical data arrays
const int unemployment[NUM_YEARS]  = {32, 87, 159, ...};
const int gdpChange[NUM_YEARS]     = {67, -85, -64, ...};
const int dowJones[NUM_YEARS]      = {381, 165, 77, ...};
An array is like a numbered shelf with slots. unemployment[0] is the first slot (1929), unemployment[1] is 1930, and so on. The values are multiplied by 10 to avoid decimal points — 3.2% becomes 32, 24.9% becomes 249. The computer works faster with whole numbers than with decimals.
Negative numbers in gdpChange mean the economy shrank that year. That’s recession.
Lines 15–26: The events array
const char* events[NUM_YEARS] = {
  "Stock Crash!",
  "Smoot-Hawley",
  ...
};
const char* means “a piece of text that never changes.” Think of it as a row of 11 sticky notes, one per year. The * (called a pointer) is how the computer knows where in memory to find each piece of text — it stores the address, not the text itself.
Lines 28–29: Tracking position and animation
int currentYear = 0;
float displayedUnemployment = 0;
currentYear is a counter that tracks which year we’re showing (0 = 1929). displayedUnemployment is what we draw on screen right now — it’s separate from the actual data because during animation it’s partway between two real values. float means it can have a decimal point like 15.3.
Lines 31–40: animateToYear() — the sliding bar trick
void animateToYear(int yr) {
  float targetUnemp = unemployment[yr] / 10.0;
  float step = (targetUnemp - displayedUnemployment) / 20.0;

  for (int f = 0; f < 20; f++) {
    displayedUnemployment += step;
    drawScreen(yr, displayedUnemployment);
    delay(30);
  }
  displayedUnemployment = targetUnemp;
}
This function makes the bar grow or shrink smoothly instead of jumping. step is how much to move each frame: the total distance divided by 20 frames. A for loop runs 20 times — f starts at 0, increases by 1 each time, and stops when it reaches 20. Each repetition adds one step, draws the screen, then waits 30ms. Twenty frames × 30ms = 600ms total animation time. Like a flip-book.
Lines 42–76: drawScreen() — painting one frame
int barLen = map((int)(unemp * 10), 0, 300, 0, 120);map() is like a ruler converter. Unemployment goes from 0% to 30% (or 0 to 300 in our × 10 system). The screen bar can be 0 to 120 pixels wide. map() converts the data range to the pixel range — so 24.9% (= 249) becomes 249/300 × 120 = ~100 pixels wide.
display.drawRect(0, 20, 128, 12, SSD1306_WHITE);
display.fillRect(0, 20, barLen, 12, SSD1306_WHITE);
drawRect draws the empty outline of the bar (like drawing a rectangle with a pencil). fillRect fills the left portion with white pixels. The combination makes a bar that shows how far along the maximum the data is.
if (unemp >= 20.0) {
  display.setTextColor(SSD1306_BLACK, SSD1306_WHITE);
  display.print("  CRISIS  ");
  display.setTextColor(SSD1306_WHITE, SSD1306_BLACK);
}
if means “only do this if the condition is true.” When unemployment is 20% or higher, it writes “CRISIS” with inverted colors (black text on white background) — a visual alarm. After writing it, colors are reset to normal (white on black).
Lines 78–95: setup() — the morning routine
pinMode(BTN_NEXT, INPUT_PULLUP);
pinMode(BTN_PREV, INPUT_PULLUP);
pinMode sets a pin as either an output (the ESP32 controls it) or an input (the ESP32 listens to it). INPUT_PULLUP means the pin reads HIGH by default; it goes LOW only when the button connects it to ground. Without this, the pin would float and trigger randomly.
The drawScreen(0, displayedUnemployment) call at the end of setup() shows the 1929 data immediately when the device powers on.
Lines 97–111: loop() — button watching
if (millis() - lastBtn < 400) return;millis() is a stopwatch that started when you plugged in power. This line says: “If less than 400ms have passed since the last button press, stop and do nothing.” This is called debouncing — buttons are mechanical and bounce electrically for a few milliseconds. Without this guard, one press could register as 10 presses.
currentYear = min(currentYear + 1, NUM_YEARS - 1);min() picks the smaller of two values. This prevents currentYear from going past 10 (the last year, 1939). If you press NEXT on 1939, it stays at 1939. The max() in the PREV button does the same for the other direction — can’t go below year 0.
The whole thing in one sentence
When powered on, the dashboard shows 1929. Each NEXT press advances one year, animating the unemployment bar to its new value. Each PREV press goes back — so you can walk your audience through the Depression one year at a time.
First thing to try: press NEXT four times quickly to reach 1933. Watch the bar grow and the “CRISIS” label appear. Then press NEXT once more to 1934 — the bar drops as the New Deal kicks in.
Check: Upload and press NEXT button. The year should advance from 1929 to 1930, with the unemployment bar growing. The GDP and Dow values should also update.
Step 3: Customize your display
Time: ~20 minutes
Add your own annotations. In the events[] array, replace any label with a more specific description relevant to your research question.
You can also add a second dataset. For example, swap GDP change for “Bank Failures” — which shows a more dramatic story (peaking at 4,000 bank failures in 1933, then dropping to near zero after FDIC was created).
To add bank failures:
const int bankFailures[NUM_YEARS] = {659, 1352, 2294, 1456, 4000, 52, 32, 44, 59, 54, 60};Step 4: Present it!
Suggested narrative for presentation:
Start at 1929: “Black Tuesday, October 29, 1929. Unemployment is a healthy 3.2%. The Dow is at 381.”
Press NEXT: “By 1930, unemployment has tripled to 8.7%. The Smoot-Hawley Tariff was just signed, raising tariffs on 20,000 goods. Trading partners retaliated — exports collapsed.”
Continue to 1933: “This is the bottom. 24.9% unemployment — nearly 1 in 4 working-age Americans. 4,000 banks have failed this year alone. FDR is inaugurated on March 4th and declares a bank holiday.”
Press forward through the New Deal years: “Social Security 1935, re-election 1936 — the unemployment bar is falling. But when FDR cuts spending in 1937 trying to balance the budget, unemployment spikes back up in 1938. That’s the ‘Roosevelt Recession.’”
Presentation tip: Let your teacher advance through the years. They feel each press. Each year is a decision. That engagement makes the data memorable in a way no poster can.
What just happened
You encoded historical data as an interactive data visualization. The animated bar that smoothly transitions between values uses linear interpolation (step = delta / frames) — the same technique used in video game animations and UI transitions.
The map() function converts your data range (0–300 for unemployment × 10) to pixel coordinates (0–128 pixels). This is the core of all data visualization: mapping data space to screen space.
Curriculum connections:
- Common Core History RH.11-12.7: Integrate and evaluate multiple sources of information presented in different media or formats
- Common Core History RH.11-12.9: Integrate information from diverse sources, both primary and secondary
- AP US History: Analyze causation, continuity and change over time, contextualization
The Roosevelt Recession of 1937–38 is particularly instructive — the data shows that the Depression wasn’t “cured” by the New Deal. It took WWII military spending (1939+) to fully end it. Your visualization makes this argument visually undeniable.
Level Up
Three simultaneous datasets: Use three rows of bar graphs — unemployment, Dow Jones (normalized), and bank failures — all updating together. Show correlation between all three.
Sound effects: Add a buzzer ($2). Play a descending tone as unemployment rises and an ascending tone as it falls. Make the economic pain audible.
International comparison: Add buttons to switch between US, Germany, UK, and France. Show how the Depression hit different countries differently — and how different policy responses (US New Deal vs. German austerity vs. UK Gold Standard) produced different outcomes.
Troubleshooting
| Problem | Fix |
|---|---|
| OLED blank | Check SDA=GPIO 8, SCL=GPIO 9 (C6: SDA=GPIO 6, SCL=GPIO 7). Try address 0x3D. Check 3.3V power. |
| Buttons not working | Check INPUT_PULLUP in setup. Button must connect GPIO to GND (not 5V). |
| Animation too fast/slow | Adjust delay(30) in animateToYear. 30ms = ~600ms total animation. |
| Numbers look wrong | Check the data array — values are × 10 (3.2% = 32 in array). |
| Upload fails | Hold BOOT button while clicking Upload. |